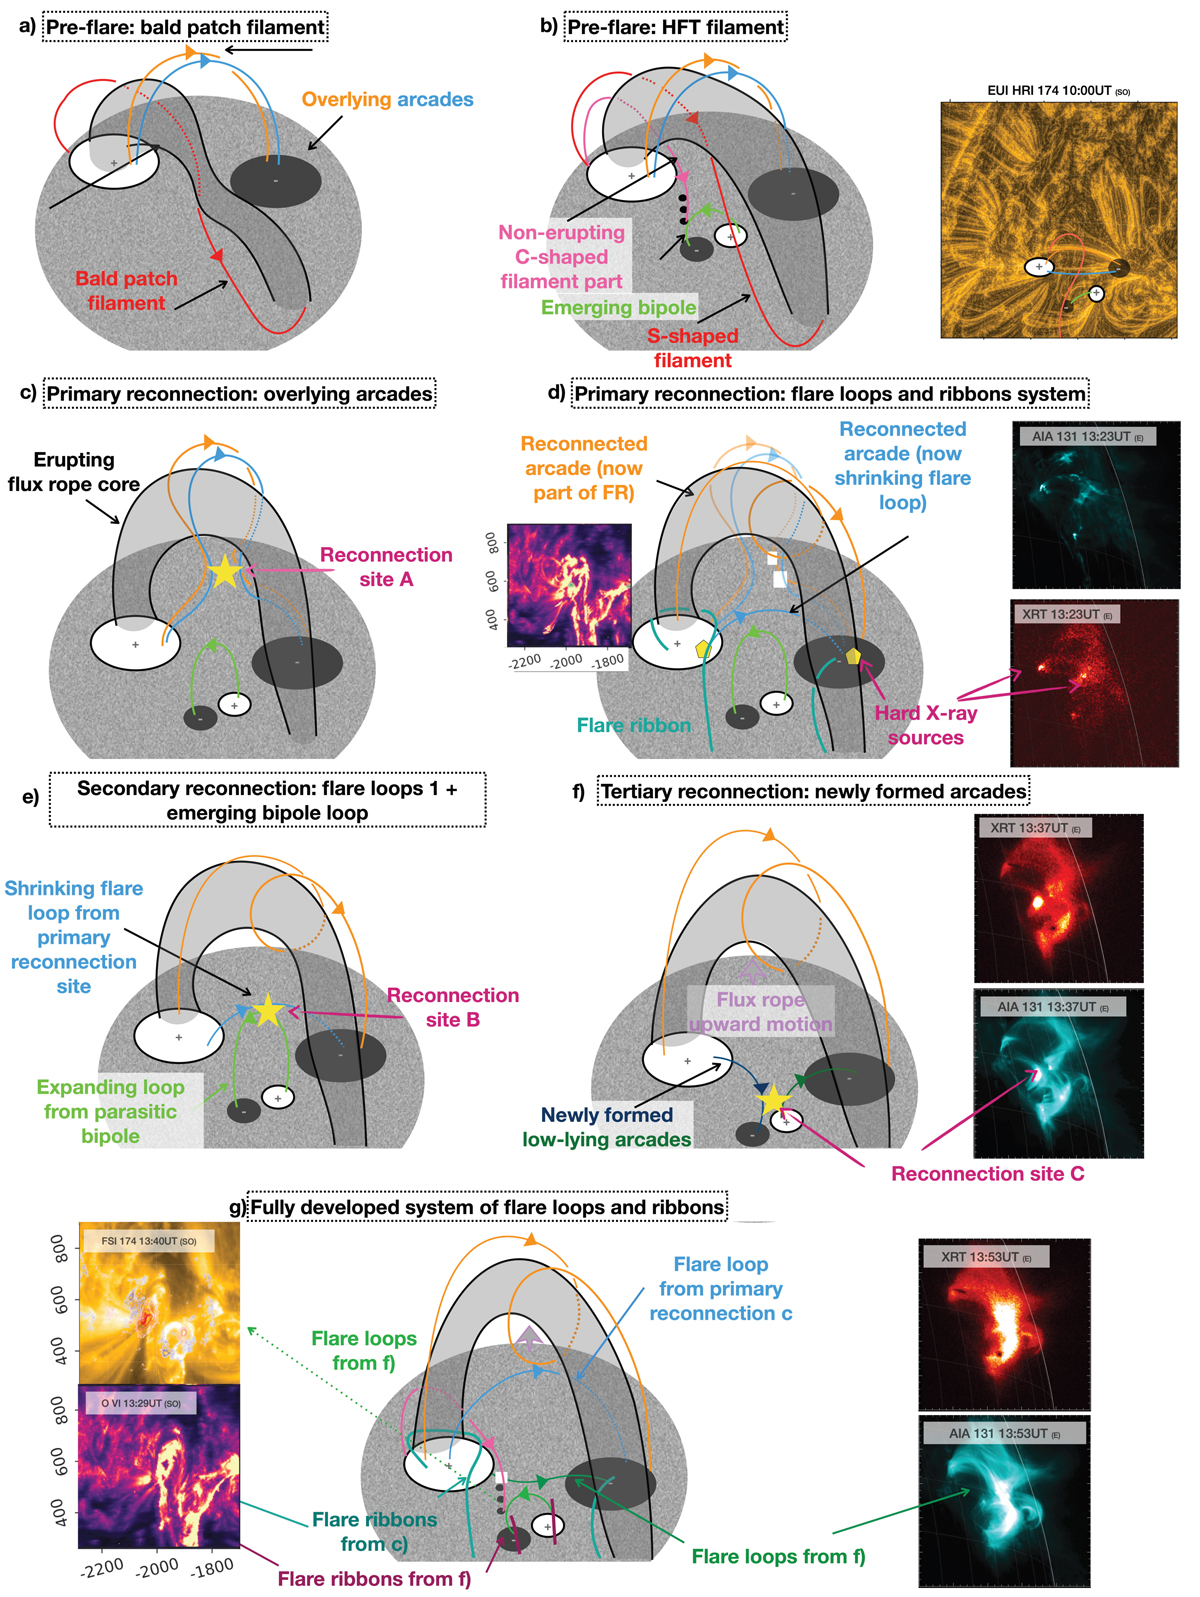
Fig. 19.

Download original image
Summary diagram showing the three reconnection events involving the overlying arcades as well as the underlying arcades of the parasitic bipole. Some observations from SDO/AIA, Hinode XRT and Solar Orbiter EUI/HRI and SPICE are shown as links to the features shown in the diagrams. Panel a) is related to the pre-flare magnetic field configuration of the bald patch filament, prior to the emergence of the parasitic polarity. Panel b shows the set of field lines describing the flux rope (red lines) and its core (grey cylinder), the overlying arcades (blue and orange), the emerging parasitic bipole (green) and the part of the northern filament that is seen after the eruption (pink). Panels b and c focus on the primary reconnection as expected from the Standard Flare Model in 3D, while panels d and e show the implication of reconnection involving the parasitic bipole. Panel f shows the complex flare ribbons and loops signatures observed in the dataset.
Current usage metrics show cumulative count of Article Views (full-text article views including HTML views, PDF and ePub downloads, according to the available data) and Abstracts Views on Vision4Press platform.
Data correspond to usage on the plateform after 2015. The current usage metrics is available 48-96 hours after online publication and is updated daily on week days.
Initial download of the metrics may take a while.


