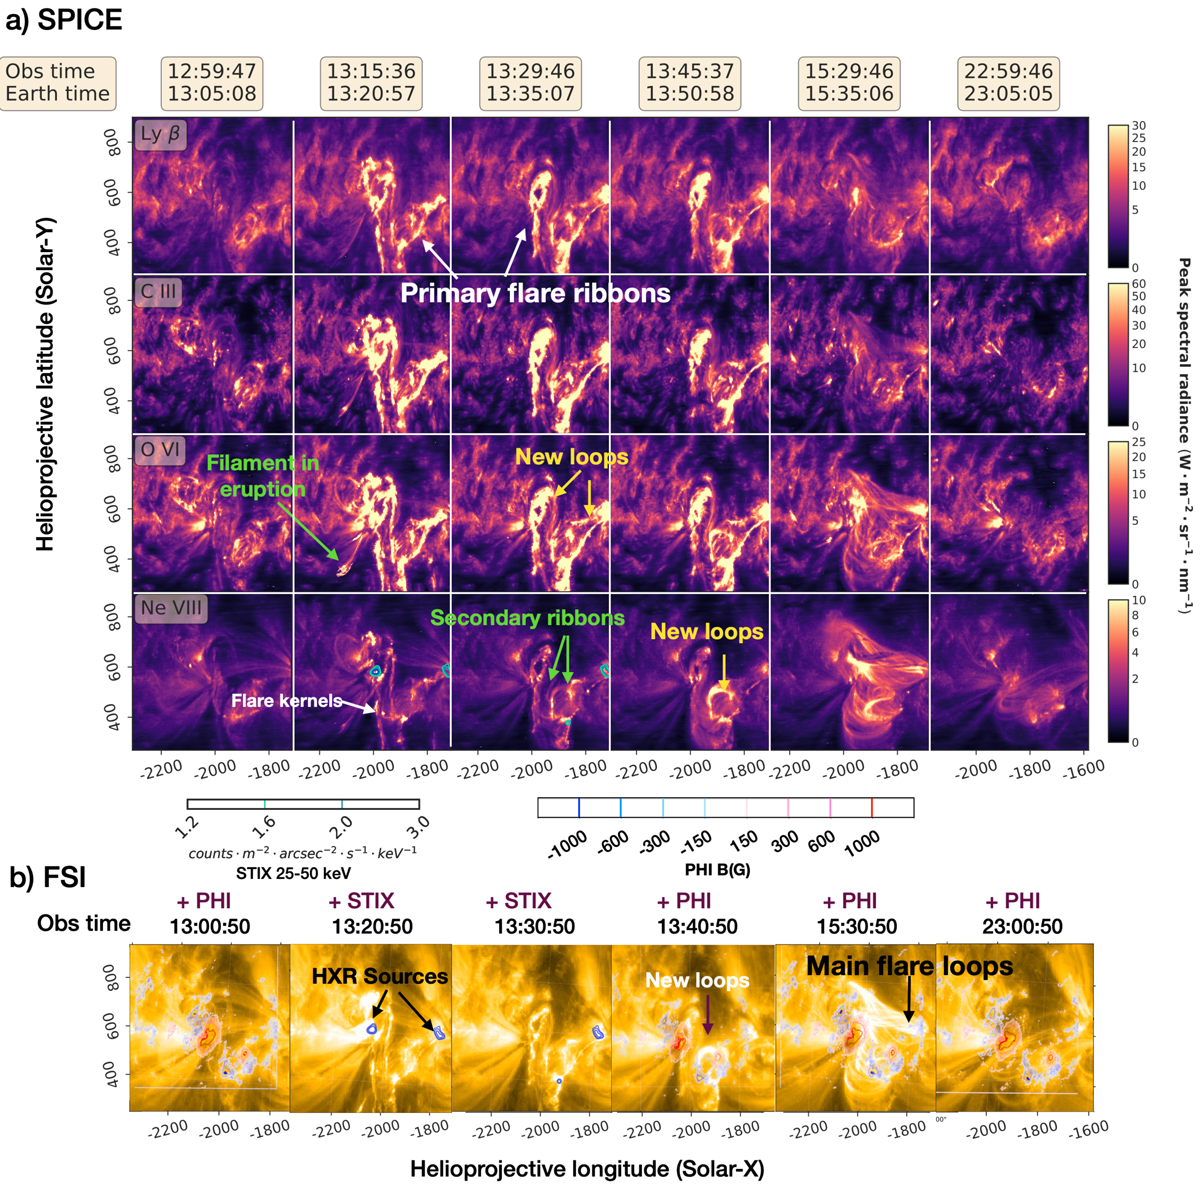
Fig. 11.

Download original image
Sequence of observations taken by four different Solar Orbiter remote-sensing instruments. a) Intensity maps for the four ions H-Ly[[INLINE36]] (104 K), C III (104.5 K), O VI (105.5 K) and Ne VIII (105.8 K) (using the line peak intensity) and for six different times from 2 April 13:00 UT until 23:00 UT. The different structures referenced in the text are indicated with their respective arrow and label. A movie is available online and at https://owncloud.ias.u-psud.fr/index.php/s/aESgKF6FXTy5YS5. b) FSI maps with the same field of view for the closest corresponding times. These maps are overlaid with the closest magnetograms from PHI (contour plots, with red indicating positive polarities and blue negative ones), as well as the non-thermal HXR sources from STIX at 13:20 and 13:30 UT (contour plots in gardients of green/blue). A movie is available online and at https://owncloud.ias.u-psud.fr/index.php/s/nedpLpAzsmRTdYz.
Current usage metrics show cumulative count of Article Views (full-text article views including HTML views, PDF and ePub downloads, according to the available data) and Abstracts Views on Vision4Press platform.
Data correspond to usage on the plateform after 2015. The current usage metrics is available 48-96 hours after online publication and is updated daily on week days.
Initial download of the metrics may take a while.


