Open Access
Fig. 9.
Download original image
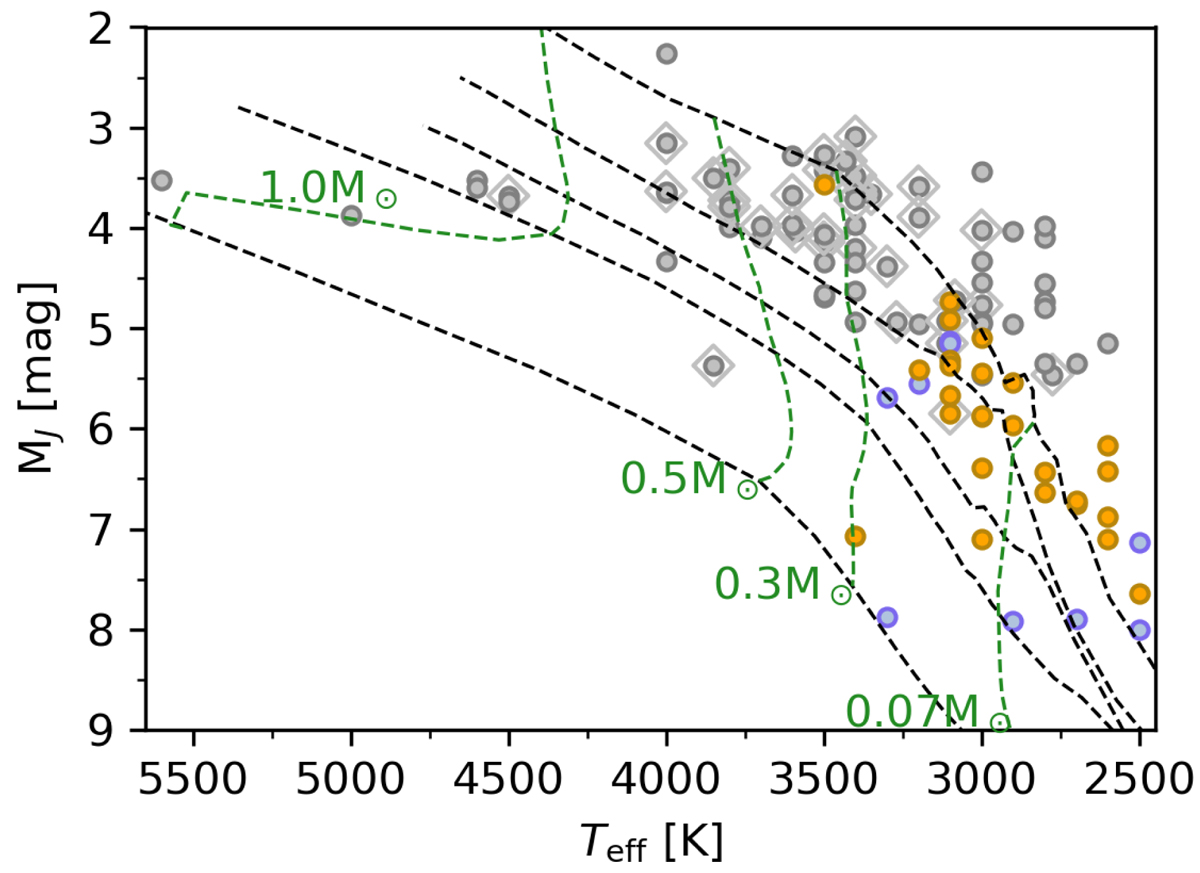
Hertzsprung-Russell diagram of all the members of NGC 2244. The color-coding is the same as in Fig. 1. The isochrones (black dashed lines, shown for 0.5, 2, 5, 10 and 100 Myr) and the lines of constant mass (green dashed lines) shown are from Baraffe et al. (2015).
Current usage metrics show cumulative count of Article Views (full-text article views including HTML views, PDF and ePub downloads, according to the available data) and Abstracts Views on Vision4Press platform.
Data correspond to usage on the plateform after 2015. The current usage metrics is available 48-96 hours after online publication and is updated daily on week days.
Initial download of the metrics may take a while.