Fig. 4.

Download original image
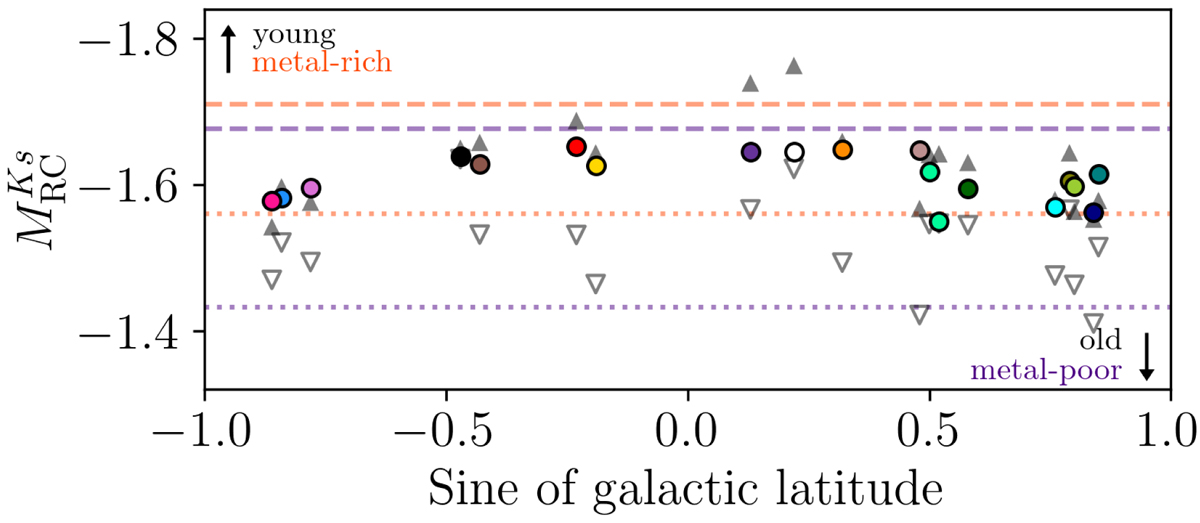
Magnitude of the red clump in Ks band estimated from our asteroseismic sample (circles, same colour scheme as in Fig. 1), and Gaia EDR3 samples before applying L21 corrections (filled triangles) and after (open triangles), as a function of the sine of the galactic latitude. The lines show predictions from modelling: purple and orange respectively for a metal-poor (−0.4 dex) and metal-rich model (+0.2 dex); dashed and dotted respectively for a young (5 Gyr) and old model (12 Gyr; see Fig. 8 in Girardi 2016). These values were chosen to be representative of the lower and upper bounds of the metallicity and age distributions in the asteroseismic fields.
Current usage metrics show cumulative count of Article Views (full-text article views including HTML views, PDF and ePub downloads, according to the available data) and Abstracts Views on Vision4Press platform.
Data correspond to usage on the plateform after 2015. The current usage metrics is available 48-96 hours after online publication and is updated daily on week days.
Initial download of the metrics may take a while.


