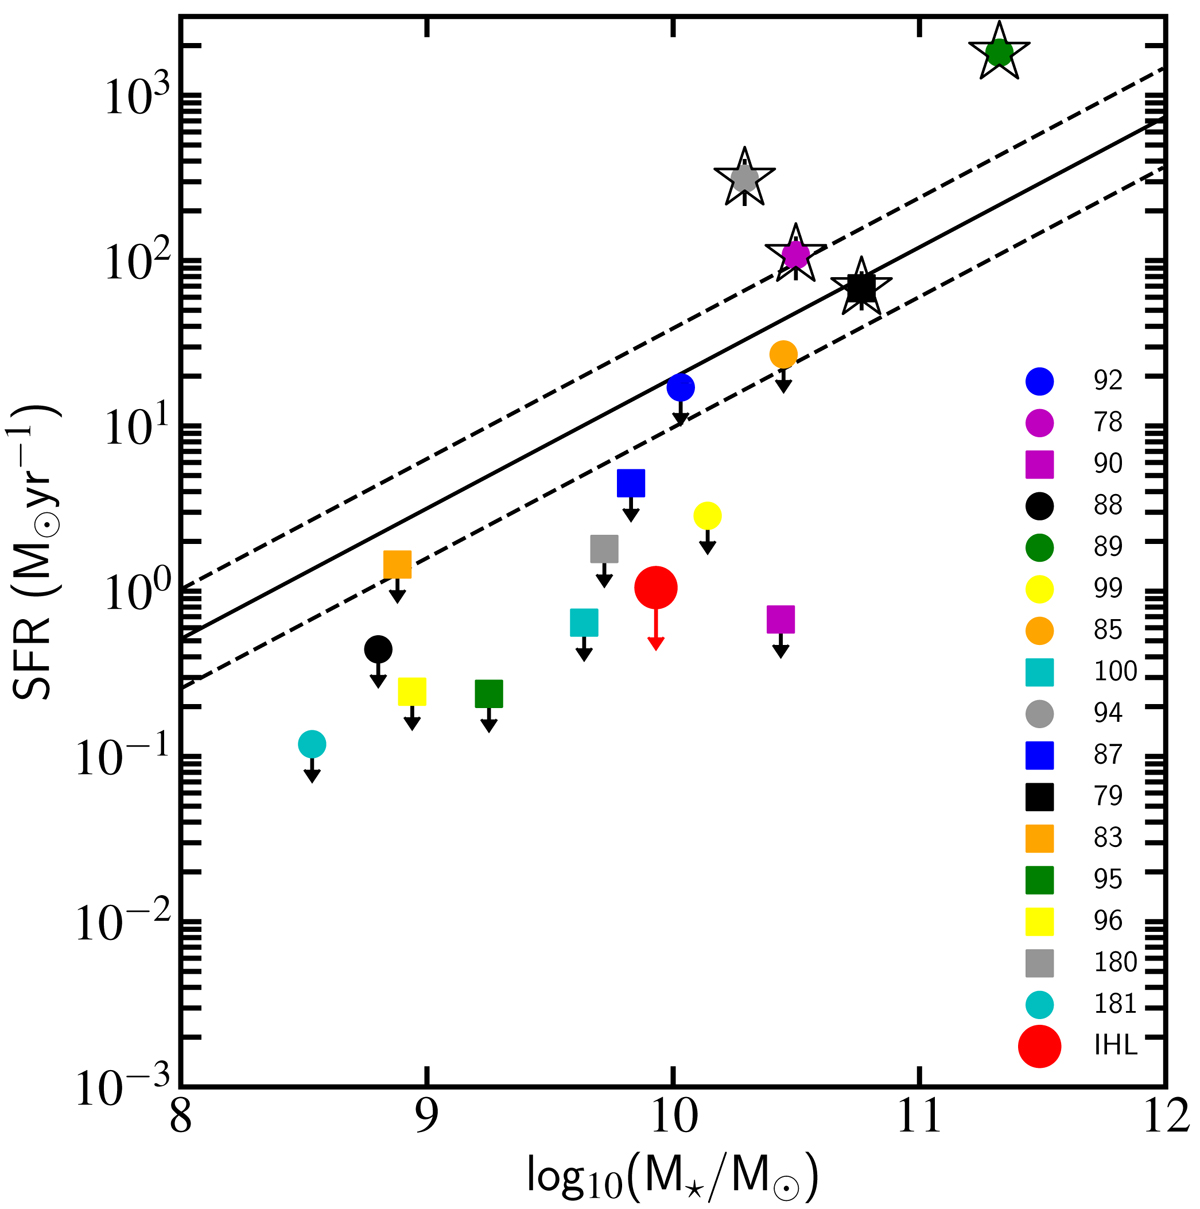
Fig. 8.
Download original image
Positions of the group galaxies with respect to the MS of star formation at z = 1.85 (black solid line, Sargent et al. 2014). The ±0.3 dex scatter on the MS is shown, and the limits on SFR are at 3σ. The IHL peak is shown in red. SFRs have been taken from FAST++, with the exception of the 4 galaxies that have detected SFRs in the FIR catalogue (indicated with a star, see also Table 1). 68% errors are shown.
Current usage metrics show cumulative count of Article Views (full-text article views including HTML views, PDF and ePub downloads, according to the available data) and Abstracts Views on Vision4Press platform.
Data correspond to usage on the plateform after 2015. The current usage metrics is available 48-96 hours after online publication and is updated daily on week days.
Initial download of the metrics may take a while.