Open Access
Fig. 3.
Download original image
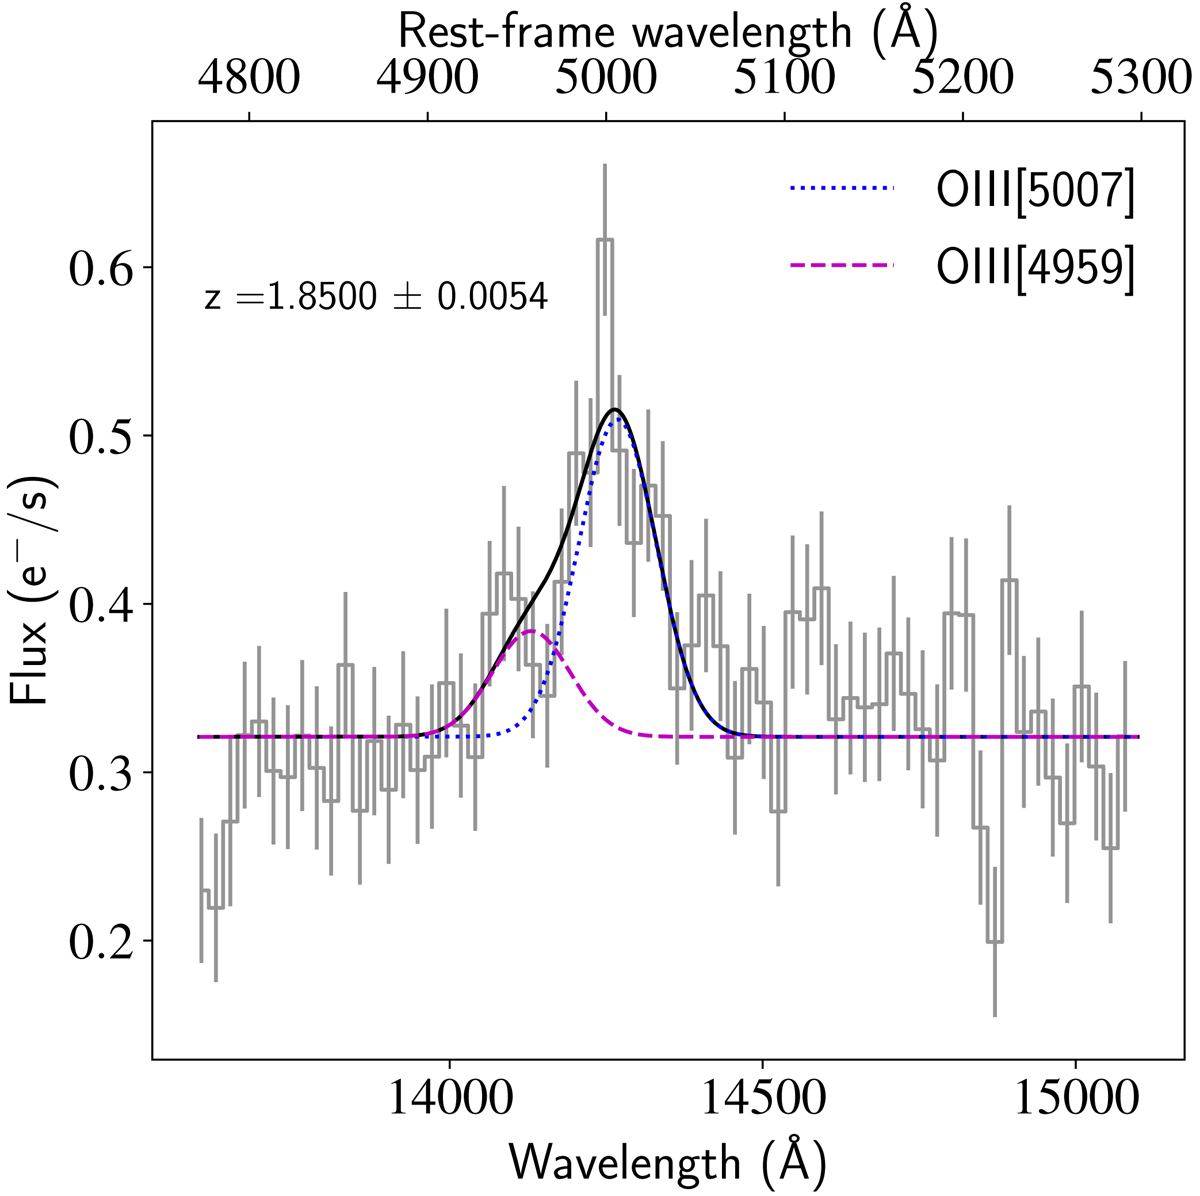
1D HST G141W grism spectrum for galaxy seg. number 89. The [OIII]5007 and [OIII]4959 Gaussian fits are shown by the coloured dotted lines, as indicated in the legend, with the sum of the two shown by the black solid line.
Current usage metrics show cumulative count of Article Views (full-text article views including HTML views, PDF and ePub downloads, according to the available data) and Abstracts Views on Vision4Press platform.
Data correspond to usage on the plateform after 2015. The current usage metrics is available 48-96 hours after online publication and is updated daily on week days.
Initial download of the metrics may take a while.