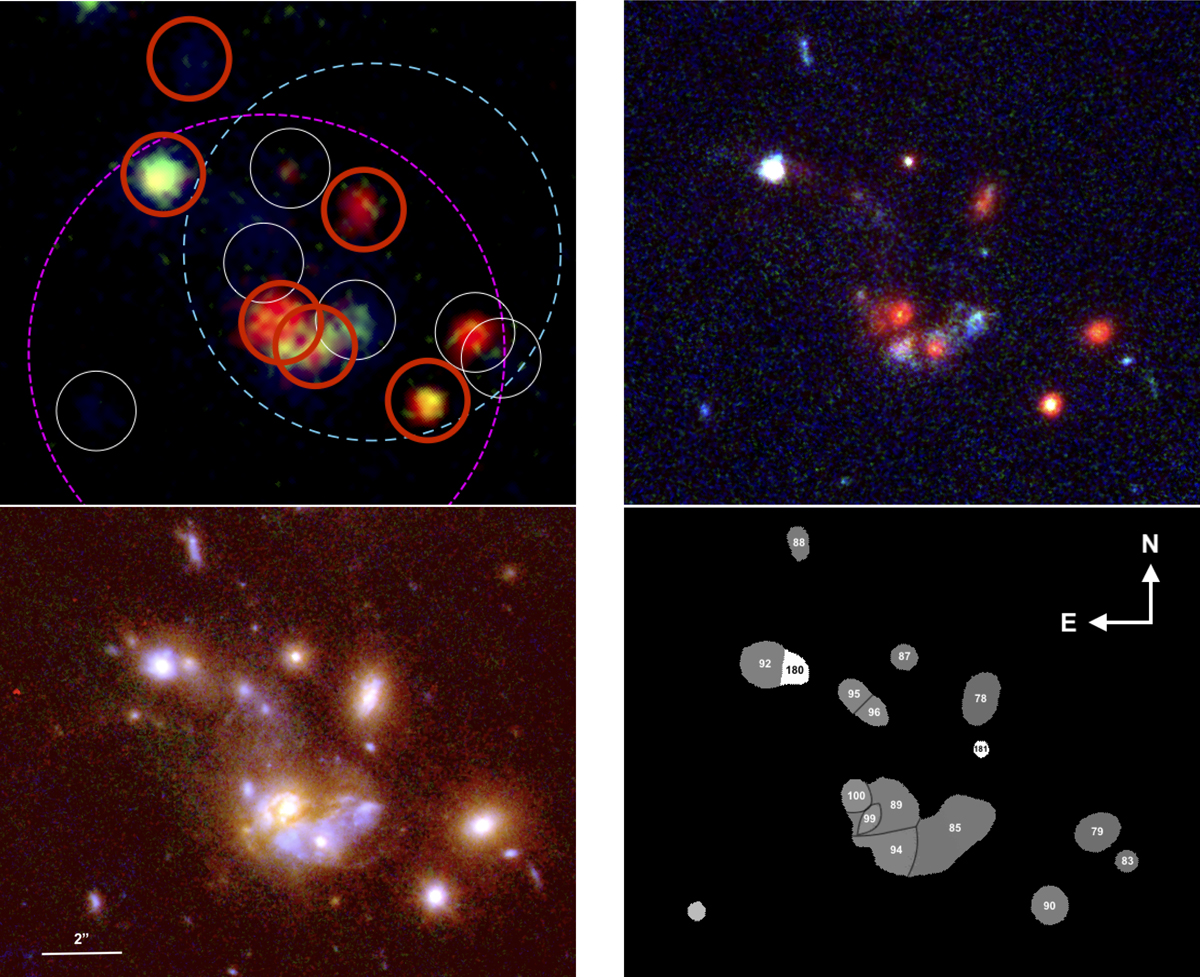
Fig. 2.
Download original image
Different views of the galaxy group at z = 1.85. Upper left: Subaru GZKs colour image of the z = 1.85 group in the EGS field. Members of the Stefanon et al. (2017) catalogue between 1.5 < zphot < 2.0 are shown by small white and red circles. The red circles indicate that spectroscopic HST grism confirmations are available (see Table 1), white is photometric only. The r = 5.98″ aperture that defines the 5.3σ overdensity is shown in magenta (south), but we also show the more concentrated r = 4.75″ aperture that gives a significance of 5.2σ in cyan (north). Upper right: HST F606W–F814W–F160W image of the group. Lower left: NIRCam F115W–F200W–F444W colour image of the group. Lower right: galaxy segmentation maps identified by SExtractor, used to measure galaxy photometry in all HST and JWST bands (borders have been drawn between some segmentation maps for clarity). We emphasise that the segmentation maps shown here are those derived from SExtractor. The radially grown mask used to exclude galaxies when making the IHL measurement is larger than the segmentation maps shown here (see Figs. 4 and 5). The lower-left galaxy is not considered as it falls outside of the cyan aperture, as discussed in the text.
Current usage metrics show cumulative count of Article Views (full-text article views including HTML views, PDF and ePub downloads, according to the available data) and Abstracts Views on Vision4Press platform.
Data correspond to usage on the plateform after 2015. The current usage metrics is available 48-96 hours after online publication and is updated daily on week days.
Initial download of the metrics may take a while.