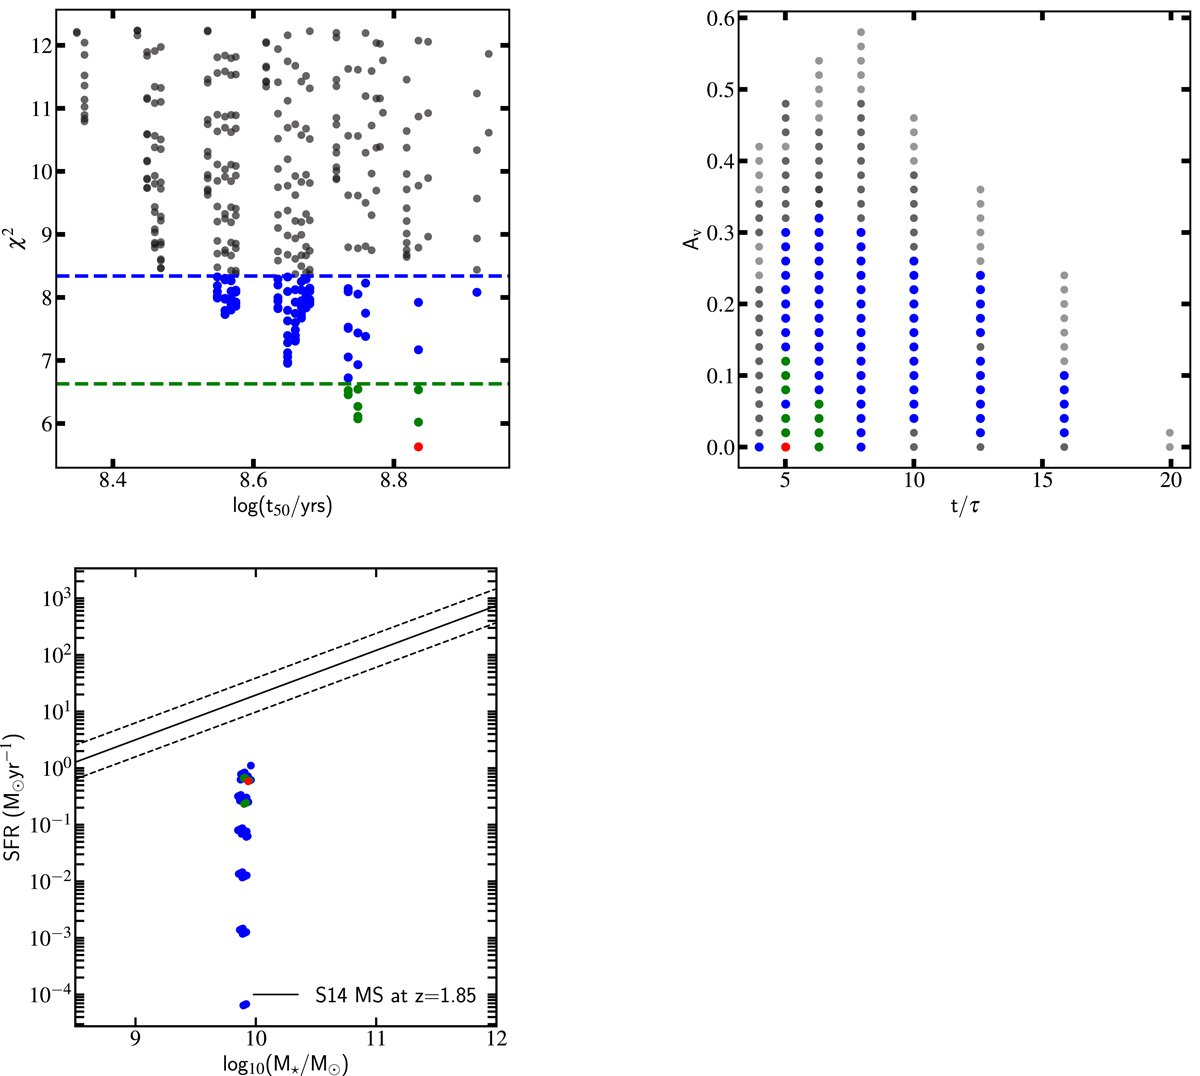
Fig. A.2.
Download original image
Parameter distributions for the peak of the IHL, as labelled. Upper left: χ2 vs t50 distribution for the peak of the IHL. Upper right: distribution of Av. vs t/τ. Lower left: the distribution of MS (Sargent et al. 2014) positions for the IHL peak. In all panels, grey points are within 3σ, blue points are within 2σ, green are within 1σ. The red points show the values corresponding to the minimum χ2.
Current usage metrics show cumulative count of Article Views (full-text article views including HTML views, PDF and ePub downloads, according to the available data) and Abstracts Views on Vision4Press platform.
Data correspond to usage on the plateform after 2015. The current usage metrics is available 48-96 hours after online publication and is updated daily on week days.
Initial download of the metrics may take a while.