Fig. 11.
Download original image
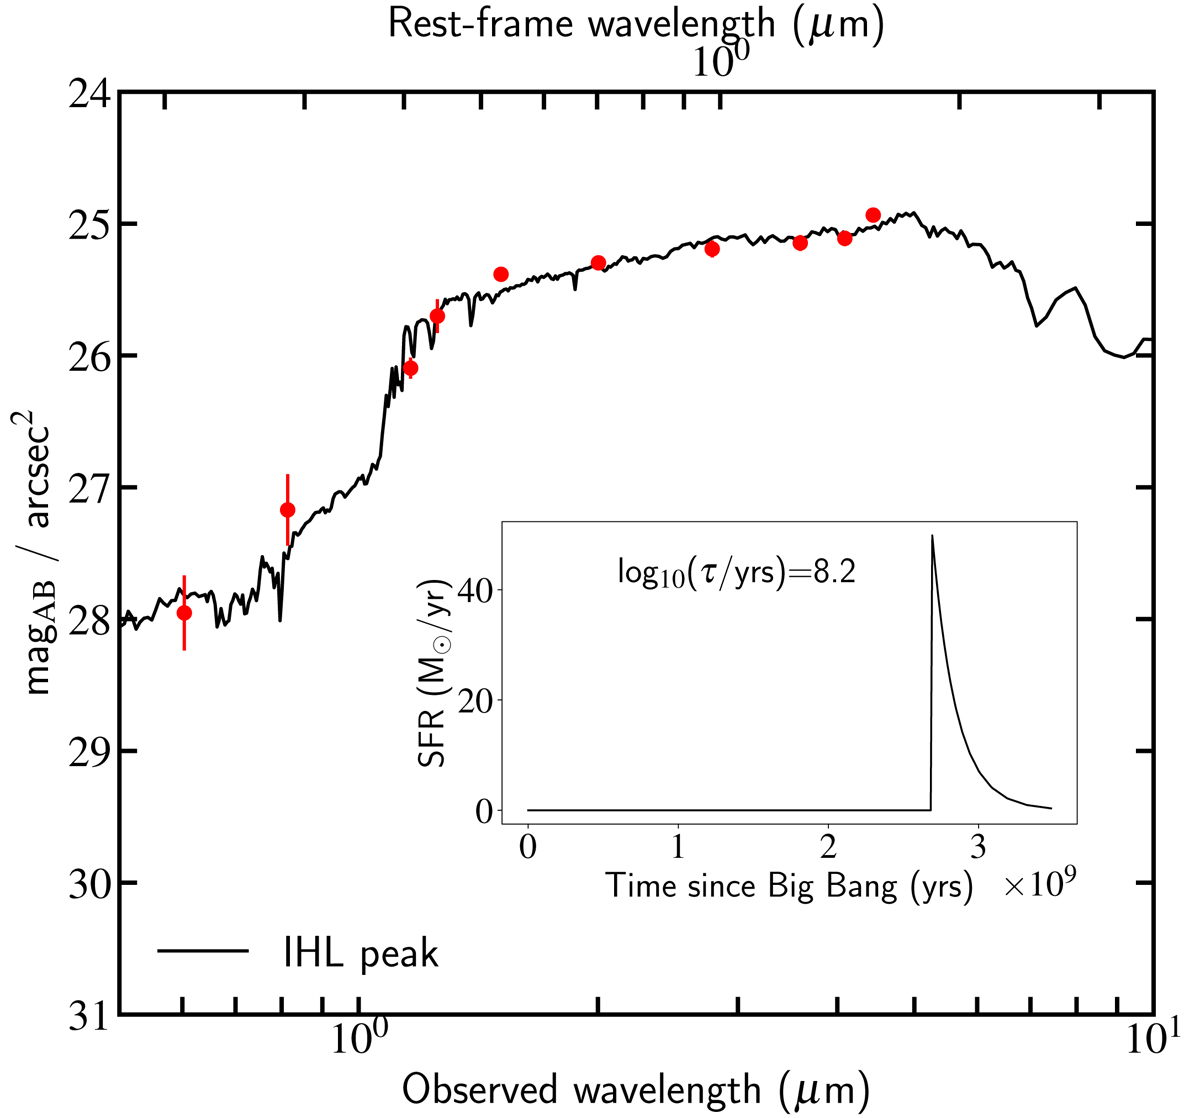
Spectral energy distribution and star formation history for the IHL peak. Main panel: surface brightness spectral energy distribution, where red shows observational data measured in a given aperture (HST and JWST), and the black line shows the best-fitting SED template found by FAST++. Detection threshold is taken at 2σ. Inset: the corresponding SFH for the peak region.
Current usage metrics show cumulative count of Article Views (full-text article views including HTML views, PDF and ePub downloads, according to the available data) and Abstracts Views on Vision4Press platform.
Data correspond to usage on the plateform after 2015. The current usage metrics is available 48-96 hours after online publication and is updated daily on week days.
Initial download of the metrics may take a while.