Fig. 3
Download original image
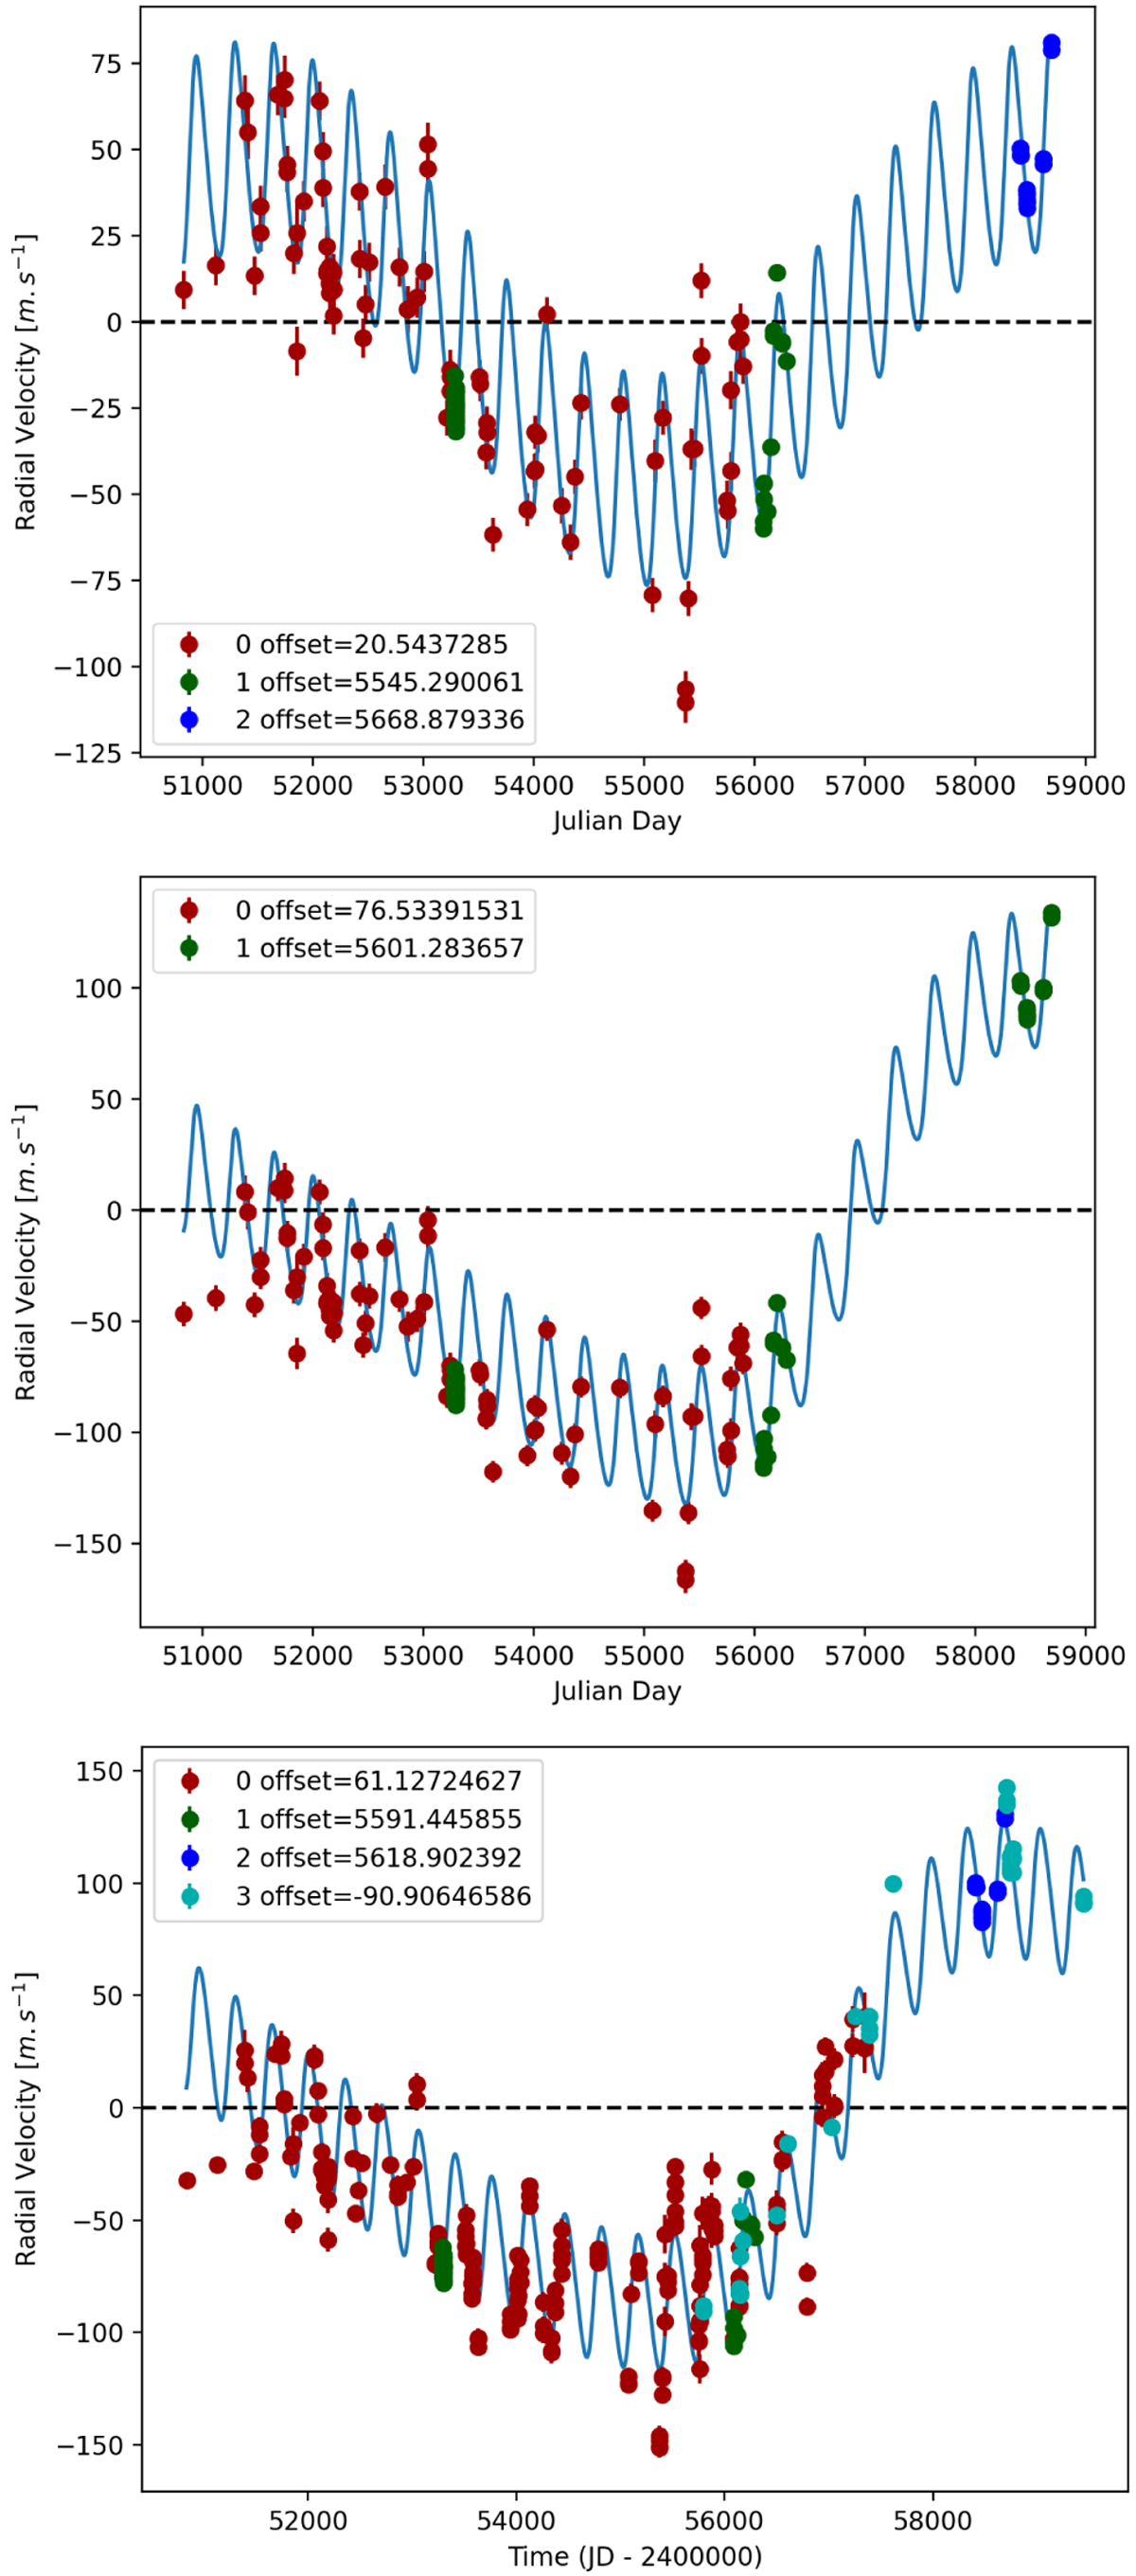
Impact of the instrumental offsets: the case of HD 142A. Top: fit (blue curve; genetic algorithm; see GitHub for the MCMC fits) of the RV with the instrumental offset between the two HARPS datasets taken as a free parameter. We use red for AAT, green for HARPS pre-upgrade, and blue for HARPS post-upgrade. Middle: fit of the RV data assuming an instrumental offset of 14.9 m s−1 between the two HARPS datasets. We use red for AAT and green for HARPS. Bottom: fit of all the RV data available. We use red for AAT, green for HARPS pre-upgrade, blue for HARPS post-upgrade, and cyan for MIKE.
Current usage metrics show cumulative count of Article Views (full-text article views including HTML views, PDF and ePub downloads, according to the available data) and Abstracts Views on Vision4Press platform.
Data correspond to usage on the plateform after 2015. The current usage metrics is available 48-96 hours after online publication and is updated daily on week days.
Initial download of the metrics may take a while.