Open Access
Fig. A.2
Download original image
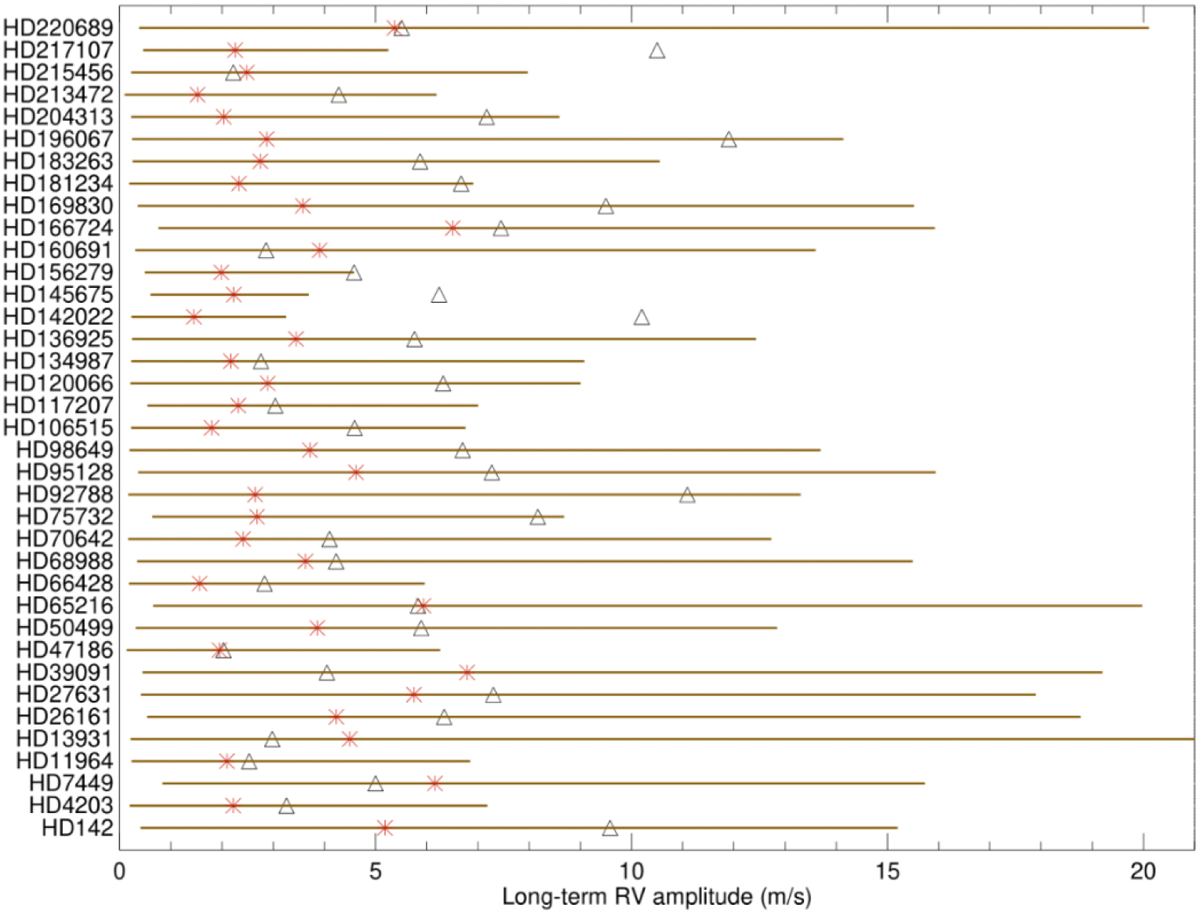
Estimated amplitudes of the long-term RV signal due to stellar activity. Triangles indicate the amplitudes measured on the RV curves, and asterisks indicate the median values found by the simulations.
Current usage metrics show cumulative count of Article Views (full-text article views including HTML views, PDF and ePub downloads, according to the available data) and Abstracts Views on Vision4Press platform.
Data correspond to usage on the plateform after 2015. The current usage metrics is available 48-96 hours after online publication and is updated daily on week days.
Initial download of the metrics may take a while.