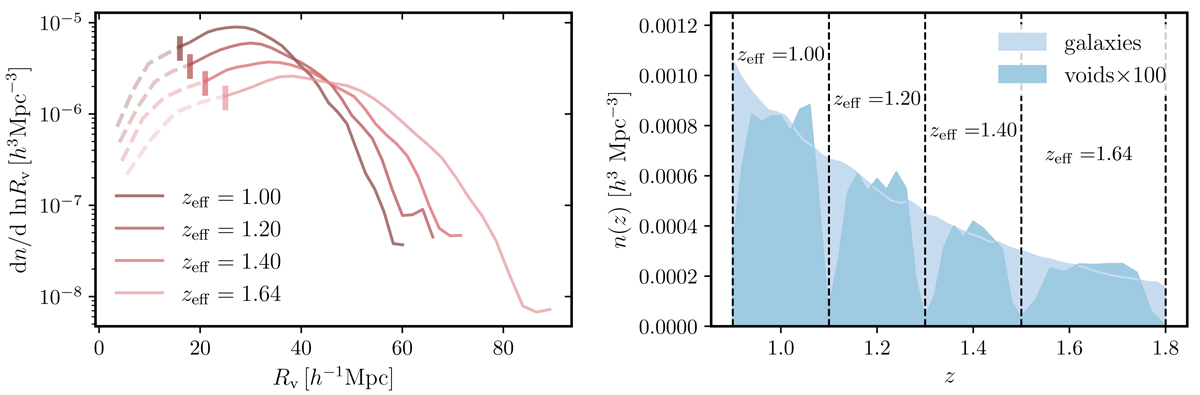
Fig. 1.
Download original image
Left: distribution of void sizes in each of the four redshift bins of the Flagship mock catalogue. The vertical bars indicate the void size cuts applied to each catalogue, and dashed lines represent the voids which are discarded. Right: comoving number density n(z) of galaxies and voids as function of redshift in Flagship. For voids, n(z) is multiplied by 100 for visibility. The edges of the redshift bins are shown by dashed vertical lines. The decrease in the number of voids near the edges of each bin arises because void-finding is performed on each bin individually as discussed in the text; some void candidates near the redshift edges of the bin are then missed.
Current usage metrics show cumulative count of Article Views (full-text article views including HTML views, PDF and ePub downloads, according to the available data) and Abstracts Views on Vision4Press platform.
Data correspond to usage on the plateform after 2015. The current usage metrics is available 48-96 hours after online publication and is updated daily on week days.
Initial download of the metrics may take a while.