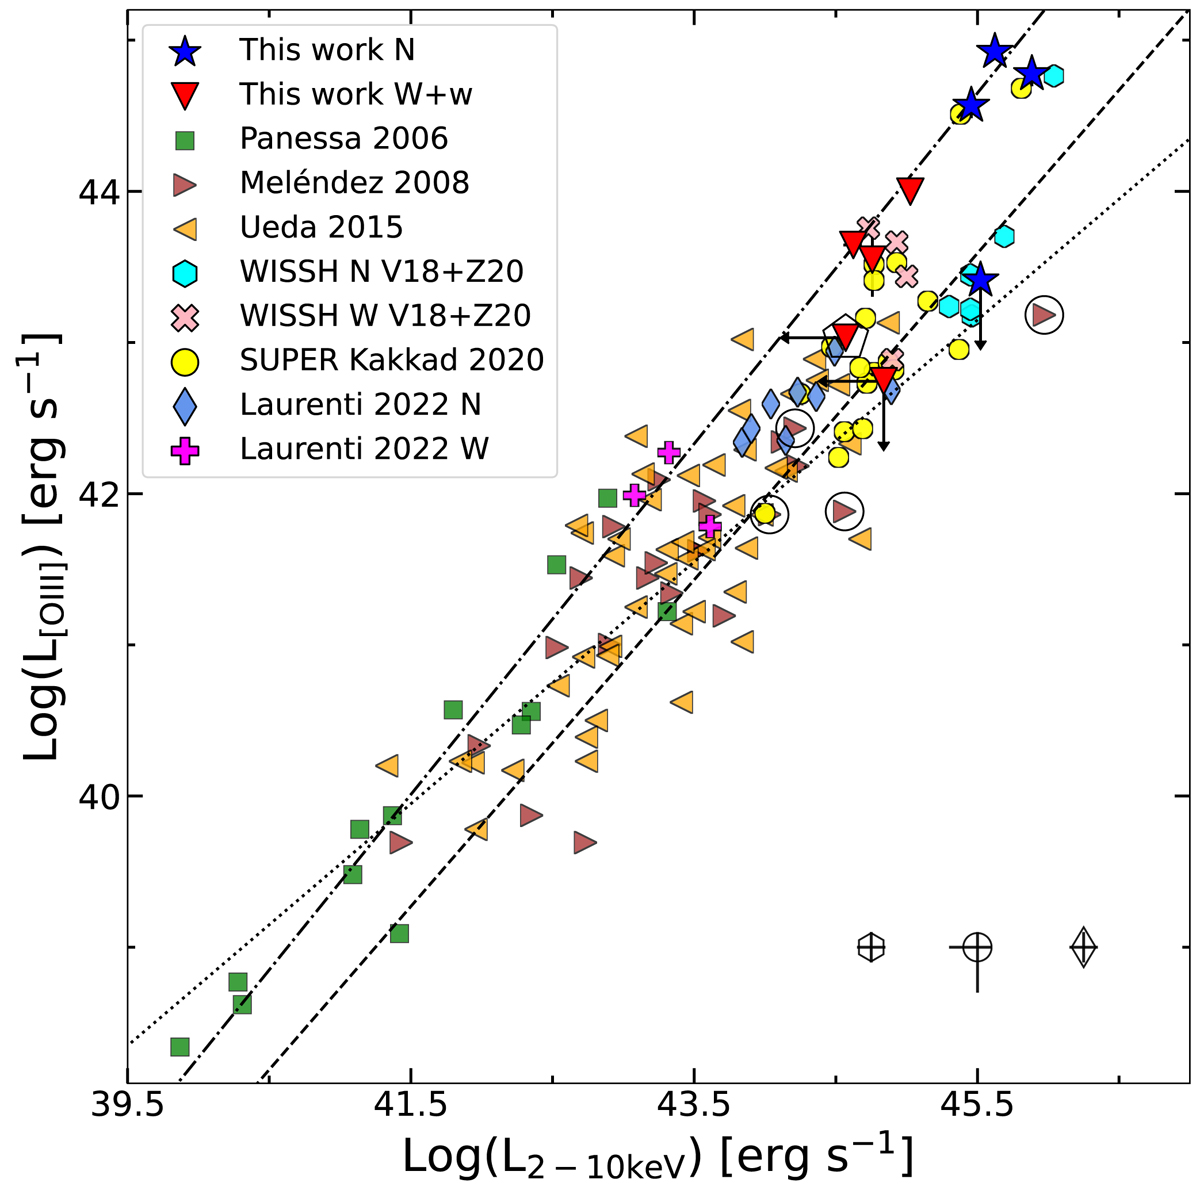
Fig. 9.
Download original image
Log(L[O III])–Log(L2–10 keV) plane. The dot-dashed, dotted, and dashed lines represent respectively the best fits for the Panessa et al. (2006), Meléndez et al. (2008), and Ueda et al. (2015) samples. Other luminous high-redshift samples with currently available [O III] and X-ray data from the WISSH (Vietri et al. 2018; Zappacosta et al. 2020) and SUPER (Kakkad et al. 2020) surveys, as well as the less luminous sample from Laurenti et al. (2022) including some X-ray weak objects, are also shown. Our objects where the [O III] is barely detectable (i.e. J0303−0023 and J1425+5406) are represented as upper limits. The circled data are defined as radio loud by the authors. BAL J0945+2305 is shown as an open pentagon. The typical uncertainties for the WISSH, SUPER, and Laurenti et al. (2022) samples are shown at the bottom of the plot.
Current usage metrics show cumulative count of Article Views (full-text article views including HTML views, PDF and ePub downloads, according to the available data) and Abstracts Views on Vision4Press platform.
Data correspond to usage on the plateform after 2015. The current usage metrics is available 48-96 hours after online publication and is updated daily on week days.
Initial download of the metrics may take a while.