Open Access
Fig. 7.
Download original image
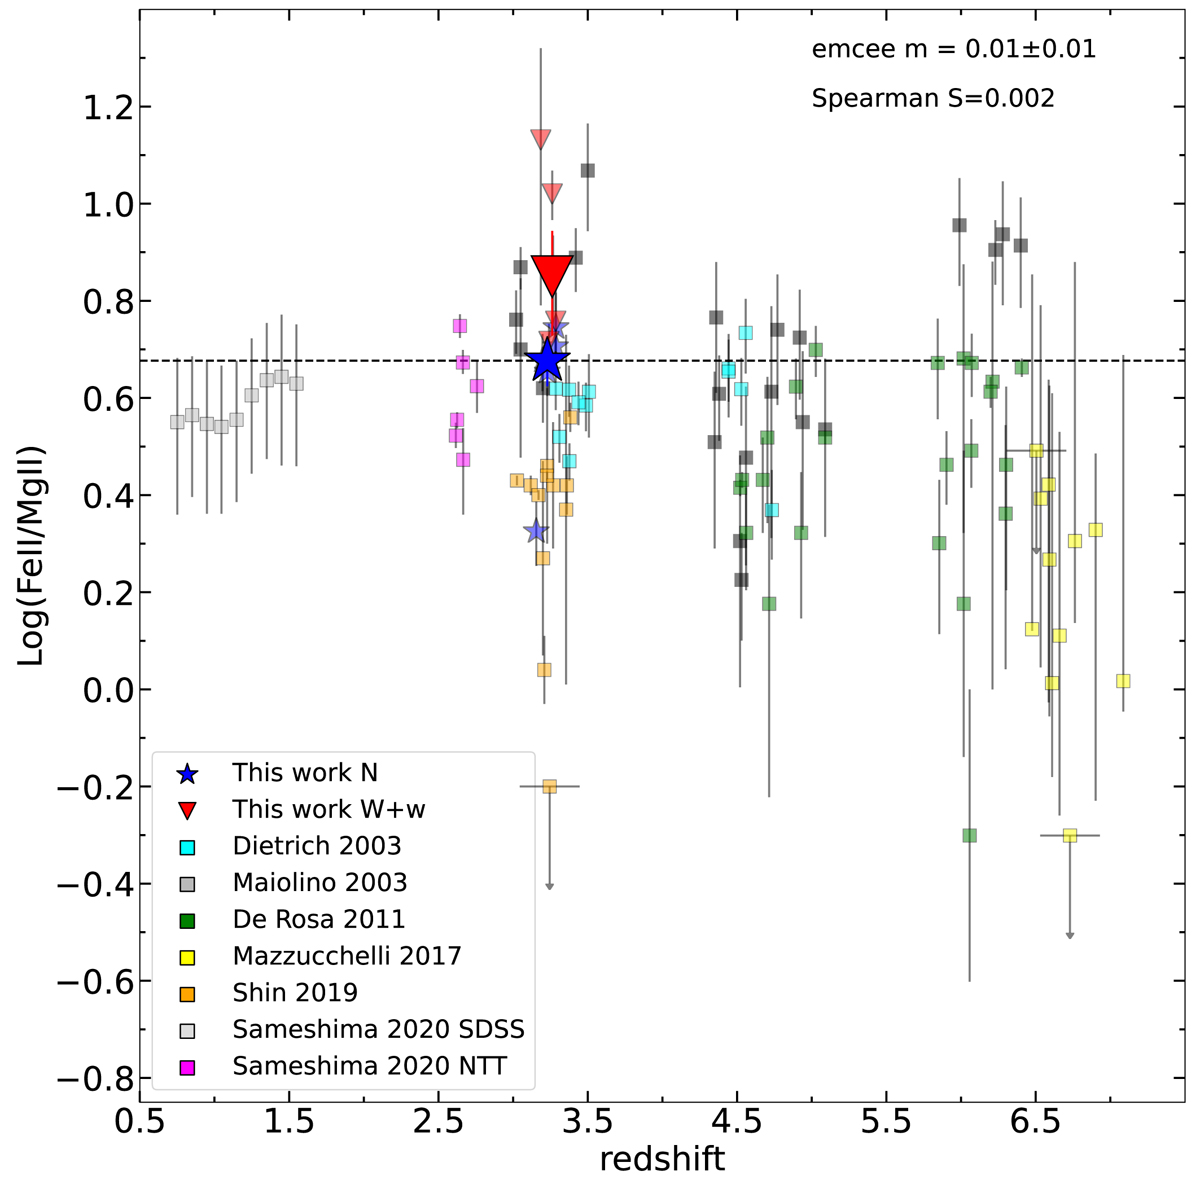
Log(Fe II/Mg II) – z plane. N sources (blue stars) follow the expectations for objects at similar redshift, whereas W+w sources (red triangles) are located at the top of the distribution around z ∼ 3. The black dashed line represents the mean Fe/Mg ratio of our N quasars extrapolated over the entire redshift range.
Current usage metrics show cumulative count of Article Views (full-text article views including HTML views, PDF and ePub downloads, according to the available data) and Abstracts Views on Vision4Press platform.
Data correspond to usage on the plateform after 2015. The current usage metrics is available 48-96 hours after online publication and is updated daily on week days.
Initial download of the metrics may take a while.