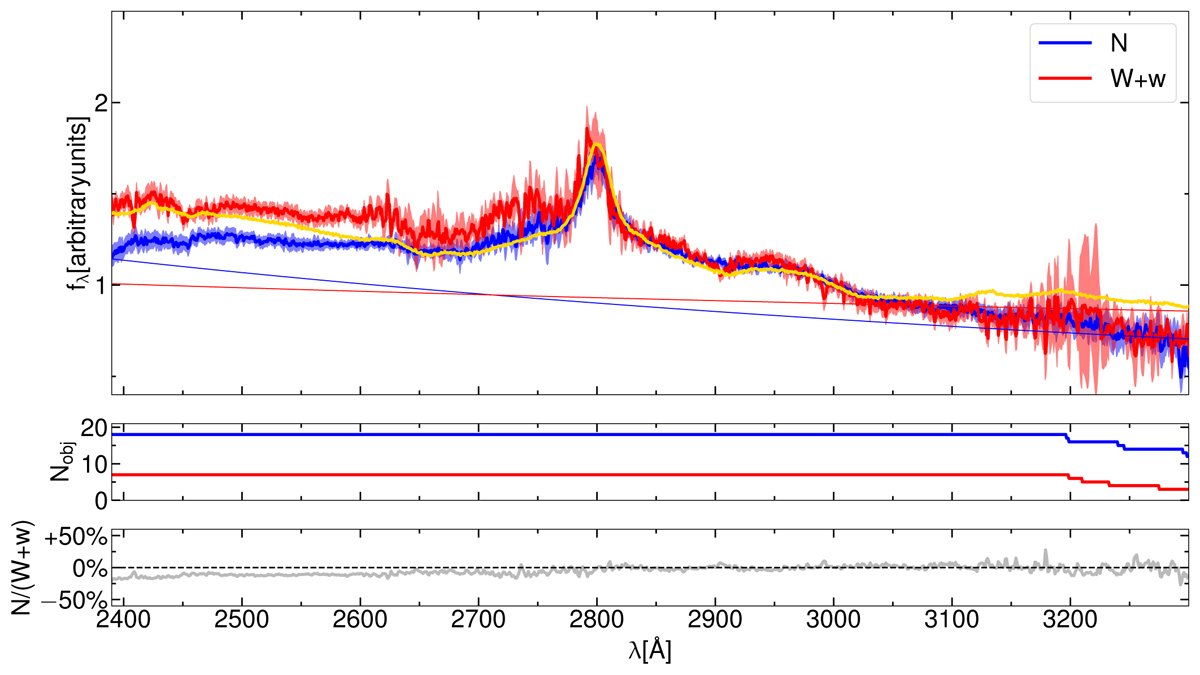
Fig. 3.
Download original image
Composite LBT zJ spectra for N and W + w quasars. Top panel: Median LBT zJ spectra for the X-ray normal (N, in blue) and the X-ray weak (W+w, in red) subsamples. The gold spectrum is the average quasar spectrum from Vanden Berk (2001). Fluxes are normalised by their value at 3000 Å. The continuum power laws are the extrapolation of those found at UV wavelengths (i.e. SDSS). Middle panel: Number of spectra contributing to each spectral channel, following to the same colour-coding. Bottom panel: Ratio of the N spectrum to the W+w spectrum.
Current usage metrics show cumulative count of Article Views (full-text article views including HTML views, PDF and ePub downloads, according to the available data) and Abstracts Views on Vision4Press platform.
Data correspond to usage on the plateform after 2015. The current usage metrics is available 48-96 hours after online publication and is updated daily on week days.
Initial download of the metrics may take a while.