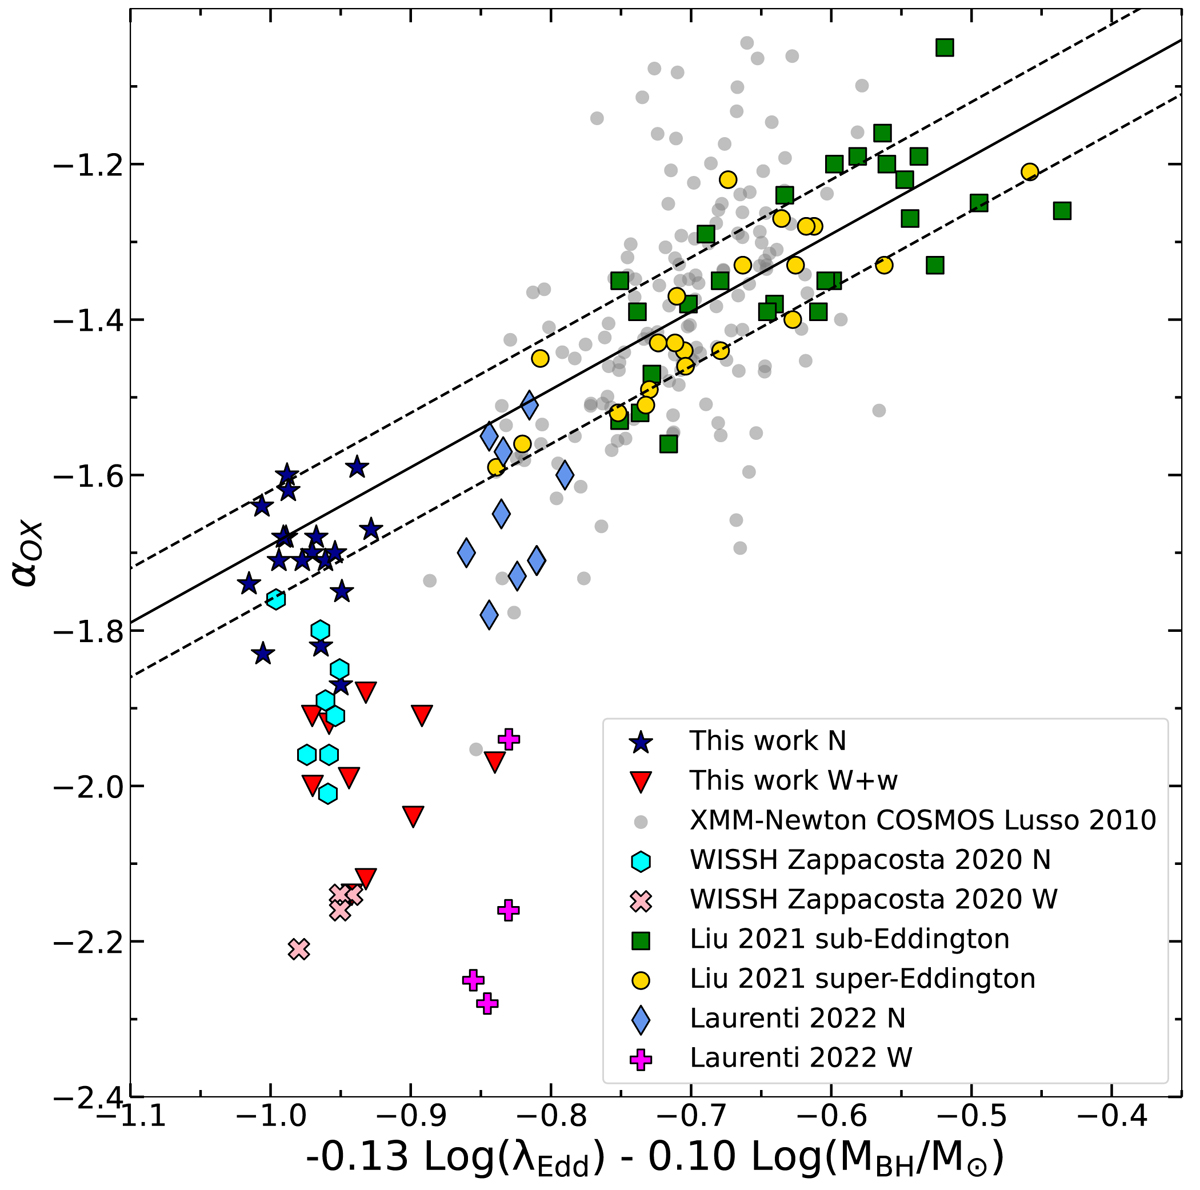
Fig. 12.
Download original image
Edge-on view on the αOX − λEdd − MBH space. The various samples are listed in the legend. The solid line is the best regression as found by Liu et al. (2021), while the dashed lines represent the 1σ dispersion. Quasars with high BH masses and high accretion rates extend the range of the relation. The bulk of our X-ray normal sources follow the extrapolation of the relation calibrated on less luminous sources at lower redshifts.
Current usage metrics show cumulative count of Article Views (full-text article views including HTML views, PDF and ePub downloads, according to the available data) and Abstracts Views on Vision4Press platform.
Data correspond to usage on the plateform after 2015. The current usage metrics is available 48-96 hours after online publication and is updated daily on week days.
Initial download of the metrics may take a while.