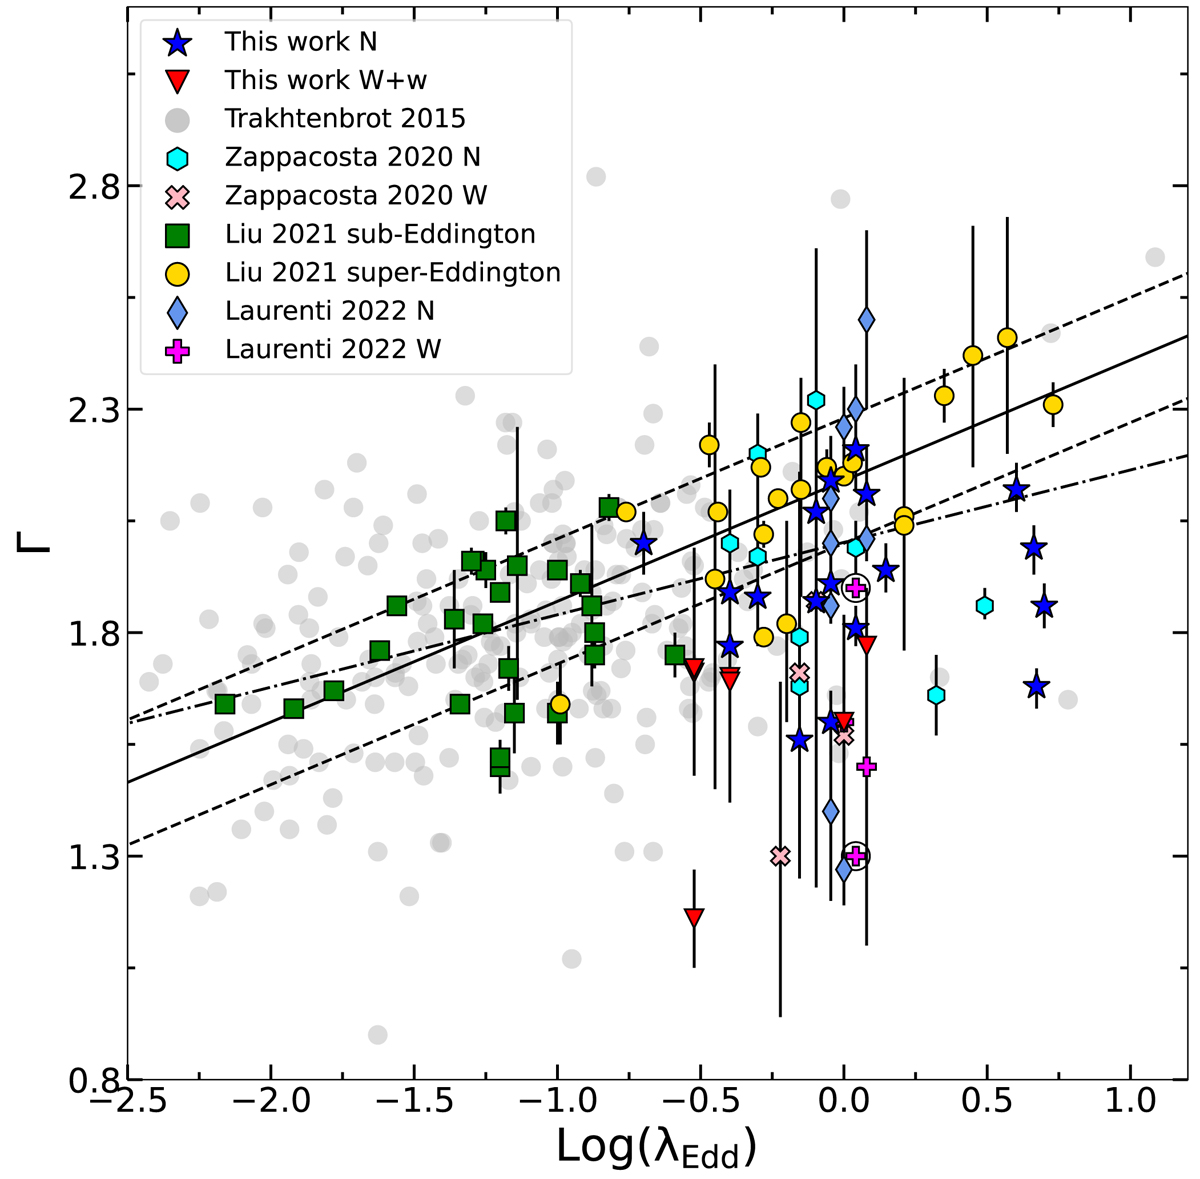
Fig. 10.
Download original image
Γ–Log(λEdd) plane. Highly accreting samples are labelled as indicated in the legend. Circled sources have a fixed Γ in their X-ray analysis. The black continuous line represents the best fit from Liu et al. (2021), which produced a slope β = 0.27 ± 0.04, while the dashed line represents the 1σ dispersion. The dot-dashed line is our best fit including all the samples (except the sources from Trakhtenbrot et al. 2017, for which there was no information about possible X-ray weak sources), which results in a flatter slope β = 0.16 ± 0.03.
Current usage metrics show cumulative count of Article Views (full-text article views including HTML views, PDF and ePub downloads, according to the available data) and Abstracts Views on Vision4Press platform.
Data correspond to usage on the plateform after 2015. The current usage metrics is available 48-96 hours after online publication and is updated daily on week days.
Initial download of the metrics may take a while.