Fig. 5
Download original image
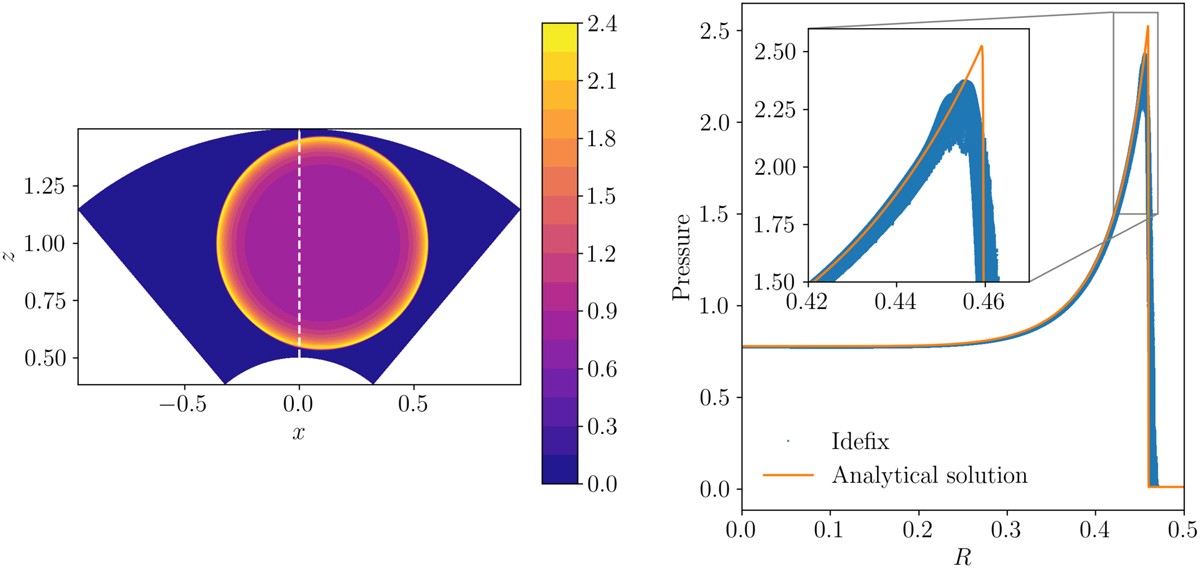
Sedov–Taylor blast wave in spherical geometry at t = 0.1. The blast is initialized slightly off the polar axis (at x = 0.1, z = 1). Left panel: slice of the pressure field through y = 0. The dashed white line represents the polar axis of the domain, which is regularized automatically by IDEFIX. Right panel: pressure distribution as a function of the distance from the blast center. The inset shows a zoom around the blast shock region.
Current usage metrics show cumulative count of Article Views (full-text article views including HTML views, PDF and ePub downloads, according to the available data) and Abstracts Views on Vision4Press platform.
Data correspond to usage on the plateform after 2015. The current usage metrics is available 48-96 hours after online publication and is updated daily on week days.
Initial download of the metrics may take a while.