Fig. 3
Download original image
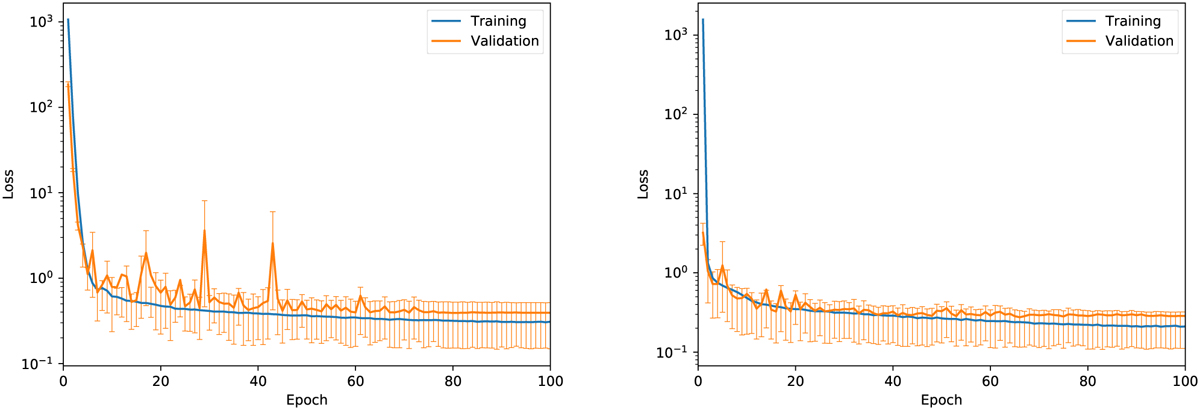
Mean training (blue) and validation (orange) loss for YOLO–CL when using 512 × 512 (left), and 1024 × 1024 (right) resampled SDSS images. The vertical bars show the lσ standard deviation of the validation loss. The training and validation loss functions converge in a smooth way. The good agreement between training and validation loss excludes significant overfitting and confirming the network stability in both cases.
Current usage metrics show cumulative count of Article Views (full-text article views including HTML views, PDF and ePub downloads, according to the available data) and Abstracts Views on Vision4Press platform.
Data correspond to usage on the plateform after 2015. The current usage metrics is available 48-96 hours after online publication and is updated daily on week days.
Initial download of the metrics may take a while.