Fig. 1
Download original image
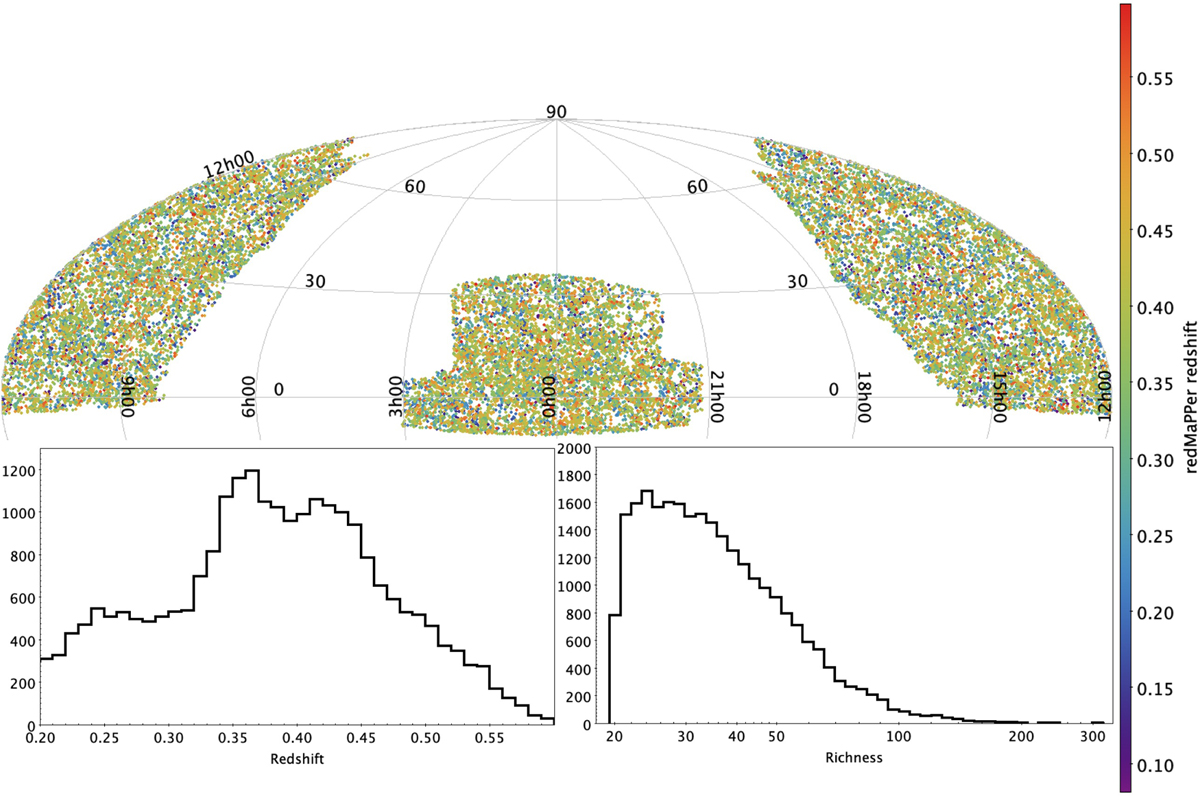
redMaPPer sample of 24 406 clusters used to train and validate our network. Top: sky map of the positions of the redMaPPer clusters in celestial coordinates, where the color indicates the photometric redshift of the cluster as estimated by the redMaPPer algorithm. Bottom: training and validation redMaPPer sample redshift (left) and richness (right) distribution.
Current usage metrics show cumulative count of Article Views (full-text article views including HTML views, PDF and ePub downloads, according to the available data) and Abstracts Views on Vision4Press platform.
Data correspond to usage on the plateform after 2015. The current usage metrics is available 48-96 hours after online publication and is updated daily on week days.
Initial download of the metrics may take a while.