Fig. 8
Download original image
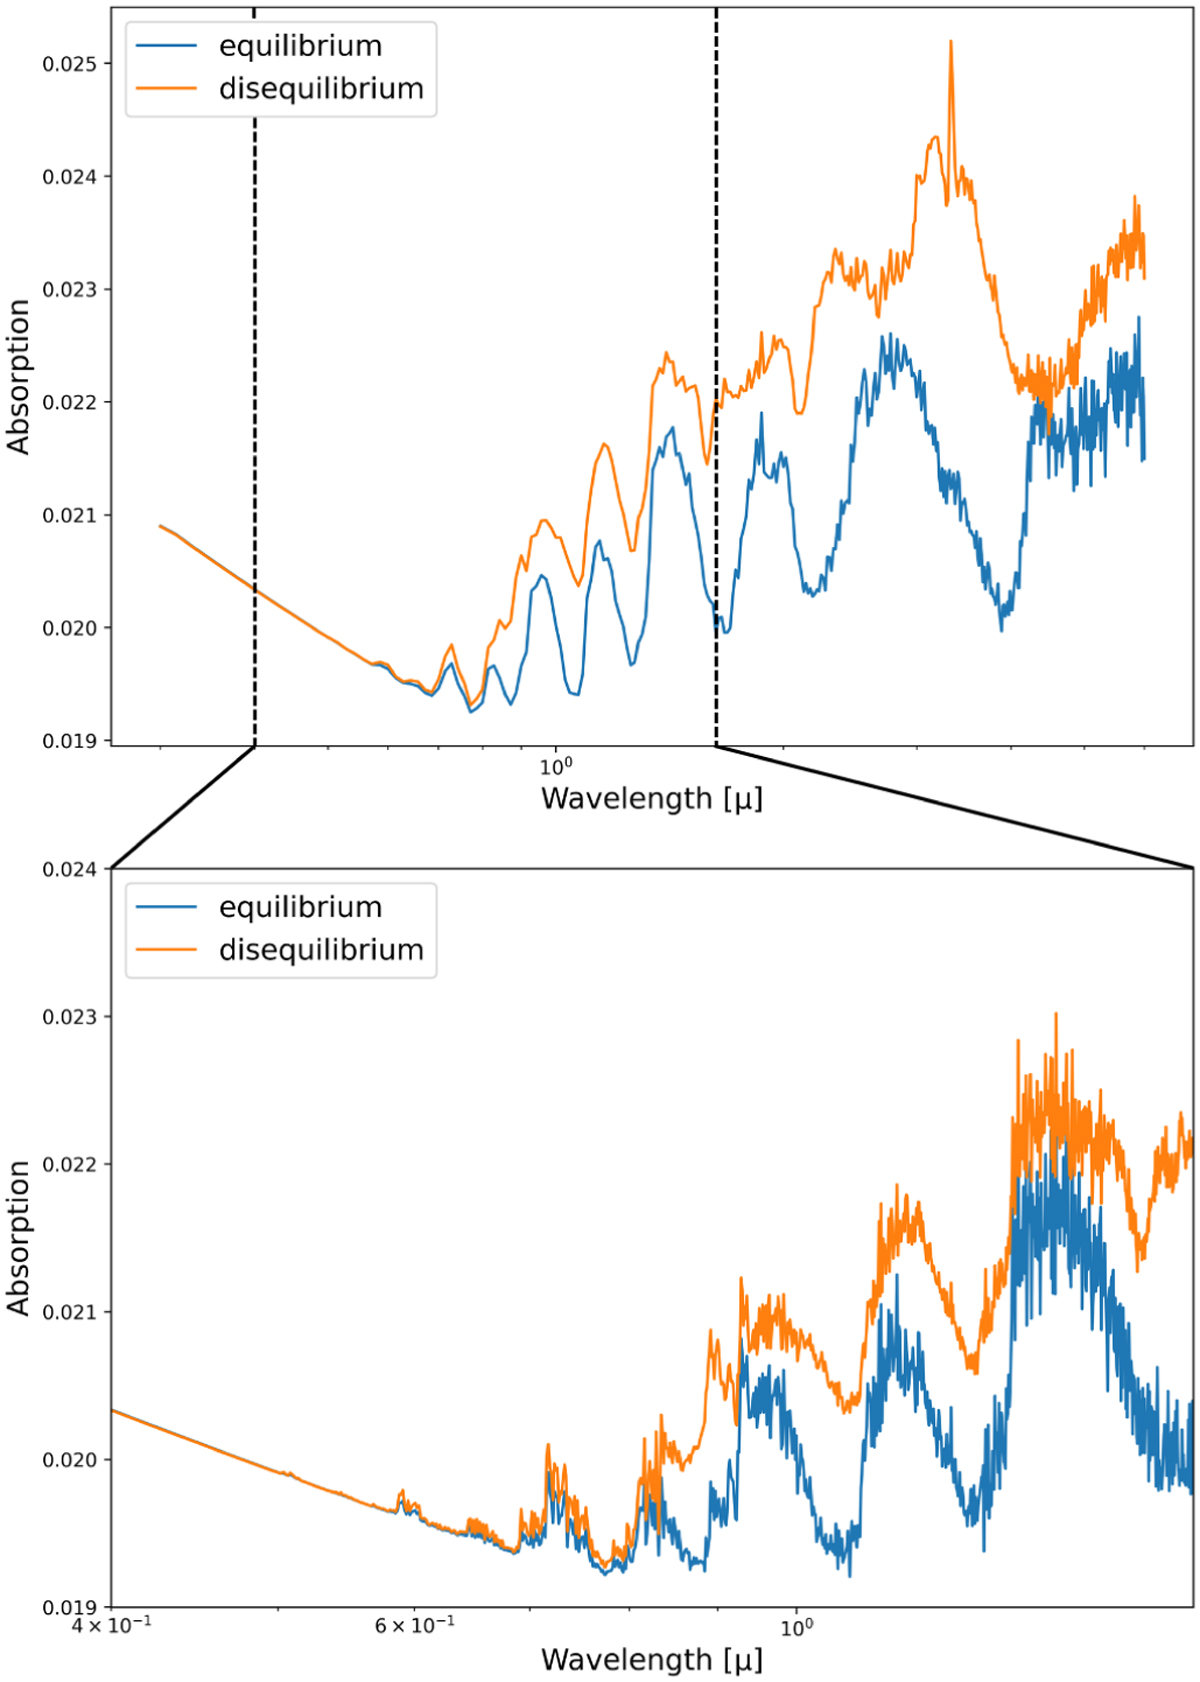
Forward models for HD 209458b, using equilibrium chemistry ACE (blue curve) and disequilibrium chemistry (orange curve). Bottom panel shows the effect of using those two different chemical schemes on the wavelength coverage of the data set presented in this study. The top panel shows the same models on a wider wavelength coverage.
Current usage metrics show cumulative count of Article Views (full-text article views including HTML views, PDF and ePub downloads, according to the available data) and Abstracts Views on Vision4Press platform.
Data correspond to usage on the plateform after 2015. The current usage metrics is available 48-96 hours after online publication and is updated daily on week days.
Initial download of the metrics may take a while.