Open Access
Fig. 2
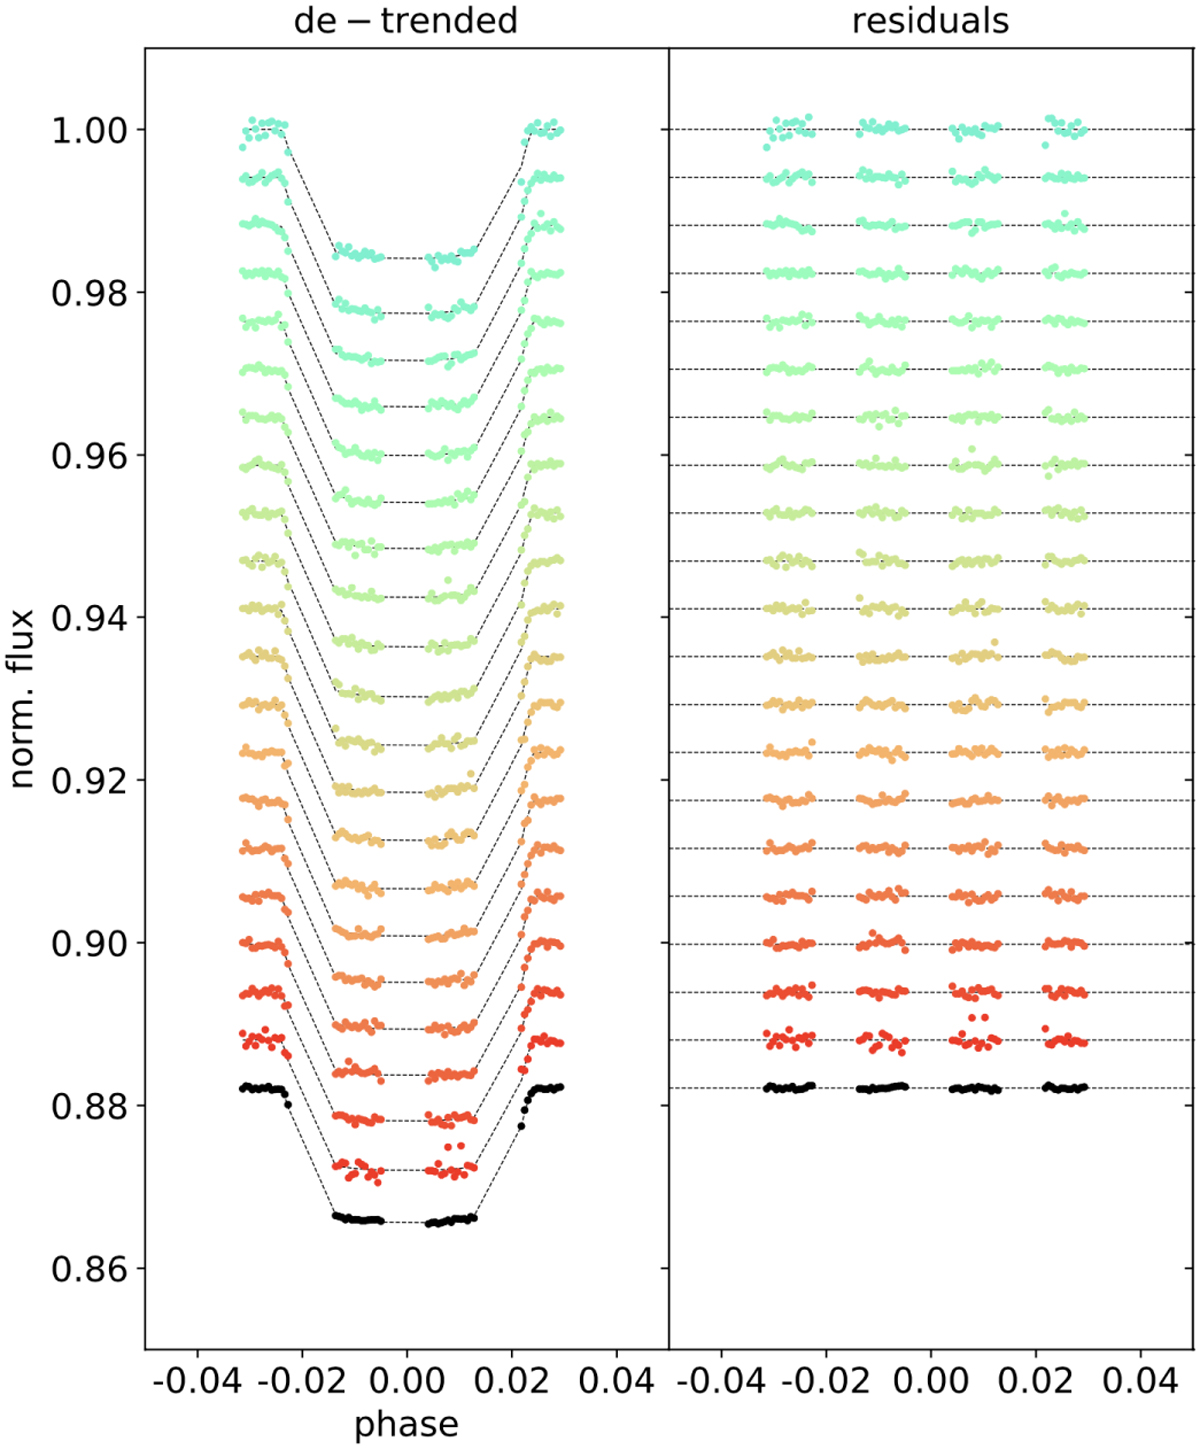
Download original image
Spectral light curve analysis for the G141 grism observation of WASP-17b taken on 2012/07/23. Left panel: white light curve in black, spectral light curve at 1.66 µm in red, and spectral light curve at 1.1 µm in blue. Right panel: corresponding residuals.
Current usage metrics show cumulative count of Article Views (full-text article views including HTML views, PDF and ePub downloads, according to the available data) and Abstracts Views on Vision4Press platform.
Data correspond to usage on the plateform after 2015. The current usage metrics is available 48-96 hours after online publication and is updated daily on week days.
Initial download of the metrics may take a while.