Fig. 9.
Download original image
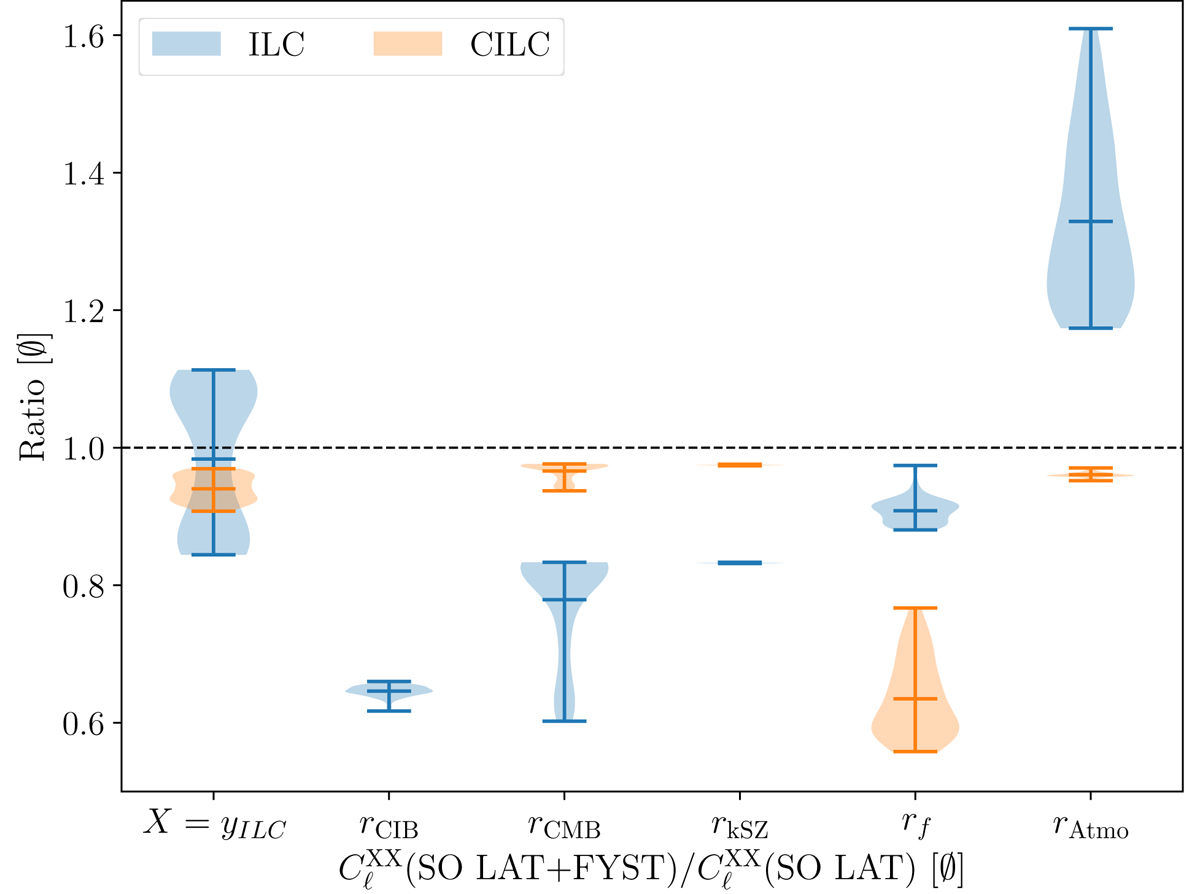
Value of the ratios of the power spectra of X for SO LAT+FYST compared to SO LAT(![]() ). The ILC-extracted Compton-y signal (yILC) and rX represent the residual noise of the quantity X. The shaded regions are the density distribution of the ratios over the ℓ range. The bar is the mean averaged over the ℓ range of the ratio distribution. In blue is the ILC case (see Sect. 5.1) and in orange is the CILC case when CIB is deprojected (see Sect. 5.2).
). The ILC-extracted Compton-y signal (yILC) and rX represent the residual noise of the quantity X. The shaded regions are the density distribution of the ratios over the ℓ range. The bar is the mean averaged over the ℓ range of the ratio distribution. In blue is the ILC case (see Sect. 5.1) and in orange is the CILC case when CIB is deprojected (see Sect. 5.2).
Current usage metrics show cumulative count of Article Views (full-text article views including HTML views, PDF and ePub downloads, according to the available data) and Abstracts Views on Vision4Press platform.
Data correspond to usage on the plateform after 2015. The current usage metrics is available 48-96 hours after online publication and is updated daily on week days.
Initial download of the metrics may take a while.