Fig. 8.
Download original image
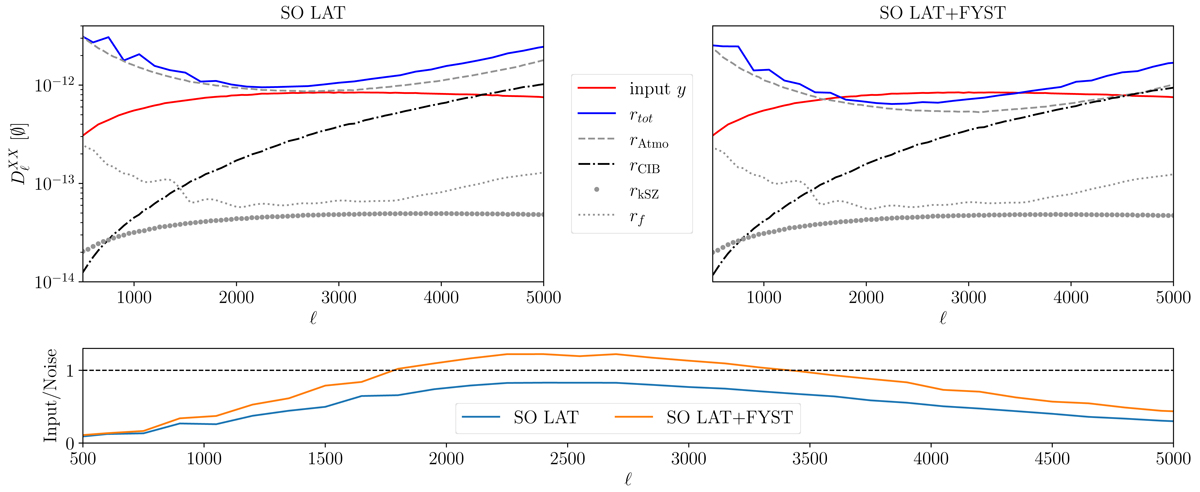
Power spectra of the CILC residual noises when deprojecting CIB compared to the input Compton-y power spectrum from the Websky simulations (red). The simulated sky contains all extragalactic components (see Table 1), Galactic foregrounds, and atmospheric noise. Top panels: power spectra of various quantities. The grey curves show the ILC noise residual power spectra, denoted by rX (X being the kSZ); the Galactic foregrounds (f); and the atmospheric noise (Atmo). The black curve shows the power spectrum of the CIB residual noise. The blue curve shows the sum of all grey and black curves, that is, the total ILC noise residual debiased for instrumental white noise and the CMB. The top-left panel shows the results for the simulated SO LAT data, while the top-right panel shows the results for the simulated data for SO LAT and FYST combined. Bottom panel: ratio between the input Compton-y power spectrum (red) and the total noise residual (blue) for SO LAT and SO LAT+FYST. All power spectra have been beam corrected and bin averaged over a window Δℓ = 50.
Current usage metrics show cumulative count of Article Views (full-text article views including HTML views, PDF and ePub downloads, according to the available data) and Abstracts Views on Vision4Press platform.
Data correspond to usage on the plateform after 2015. The current usage metrics is available 48-96 hours after online publication and is updated daily on week days.
Initial download of the metrics may take a while.