Fig. 6.
Download original image
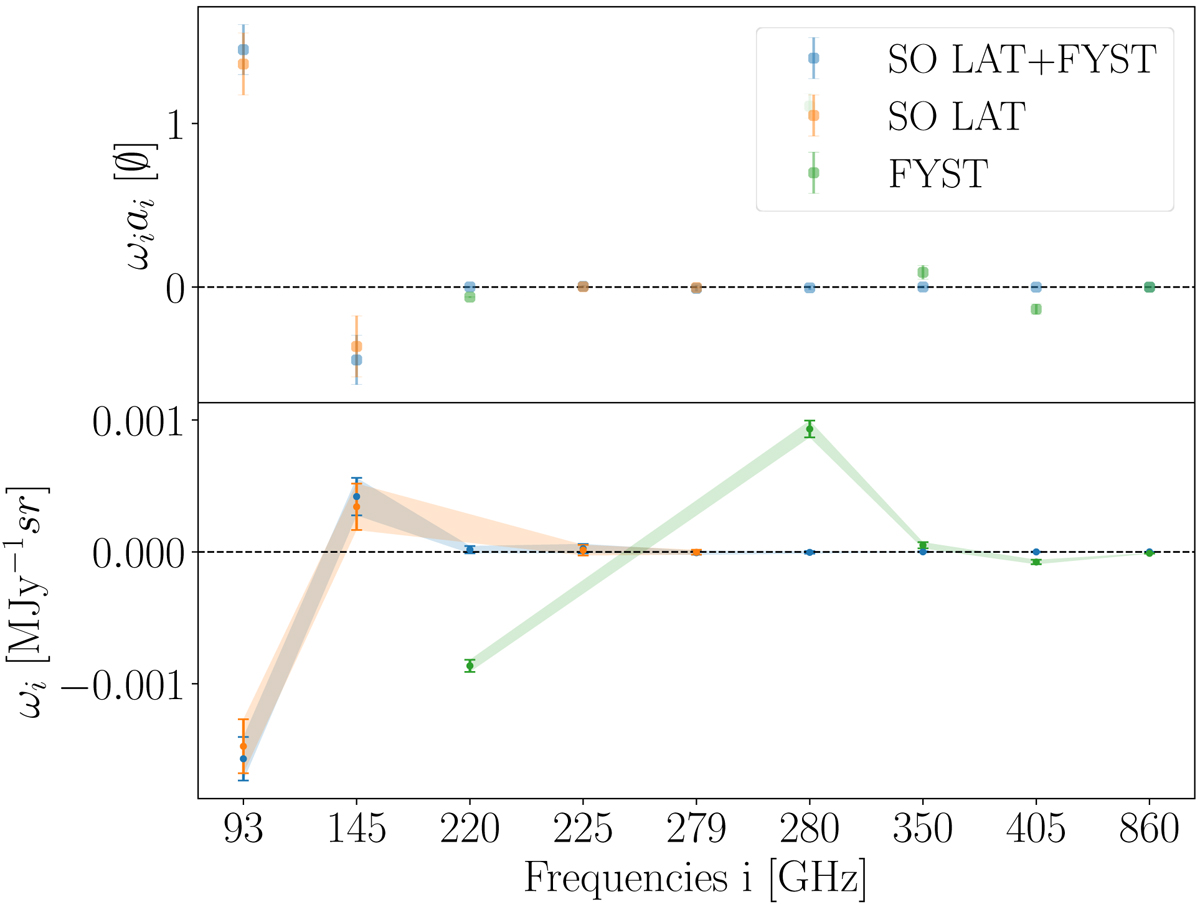
Internal linear combination weights for SO LAT-like (orange) and FYST-like (green) experiments and SO LAT+FYST (blue) when the sky contains all extragalactic components (see Table 1), Galactic foregrounds, and atmospheric noise. Top figure: fractional contribution of each frequency channel to the recovered y-map. Bottom figure: frequency channels that contribute to maximising the tSZ signal and minimising the noise. The error bars show the standard deviation around the mean weight of all of the 192 tessellated fields for each frequency map.
Current usage metrics show cumulative count of Article Views (full-text article views including HTML views, PDF and ePub downloads, according to the available data) and Abstracts Views on Vision4Press platform.
Data correspond to usage on the plateform after 2015. The current usage metrics is available 48-96 hours after online publication and is updated daily on week days.
Initial download of the metrics may take a while.