Fig. 5.
Download original image
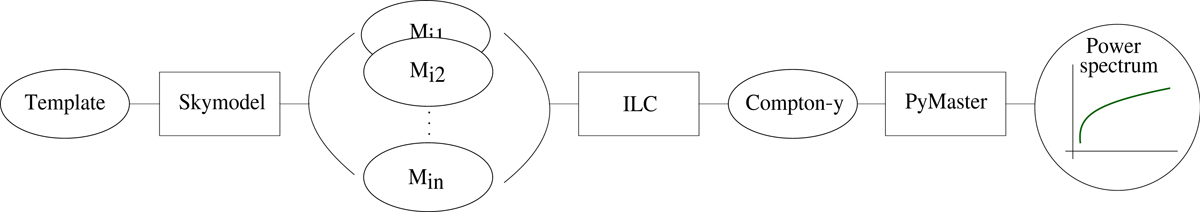
Scheme of the method we use in this paper to extract the tSZ signal. The input of the sky model is template maps coming from the Websky simulations and PySM. The sky model processes them to produce maps of the different sky components at a given frequency, sensitivity, and beam. This set of multi-frequency maps {Mi1, …, Min} was smoothed to a common resolution and tessellated, and the Compton-y signal was extracted by the ILC. The PyMaster algorithm was used on the resulting masked map to extract the power spectrum.
Current usage metrics show cumulative count of Article Views (full-text article views including HTML views, PDF and ePub downloads, according to the available data) and Abstracts Views on Vision4Press platform.
Data correspond to usage on the plateform after 2015. The current usage metrics is available 48-96 hours after online publication and is updated daily on week days.
Initial download of the metrics may take a while.