Open Access
Fig. 3.
Download original image
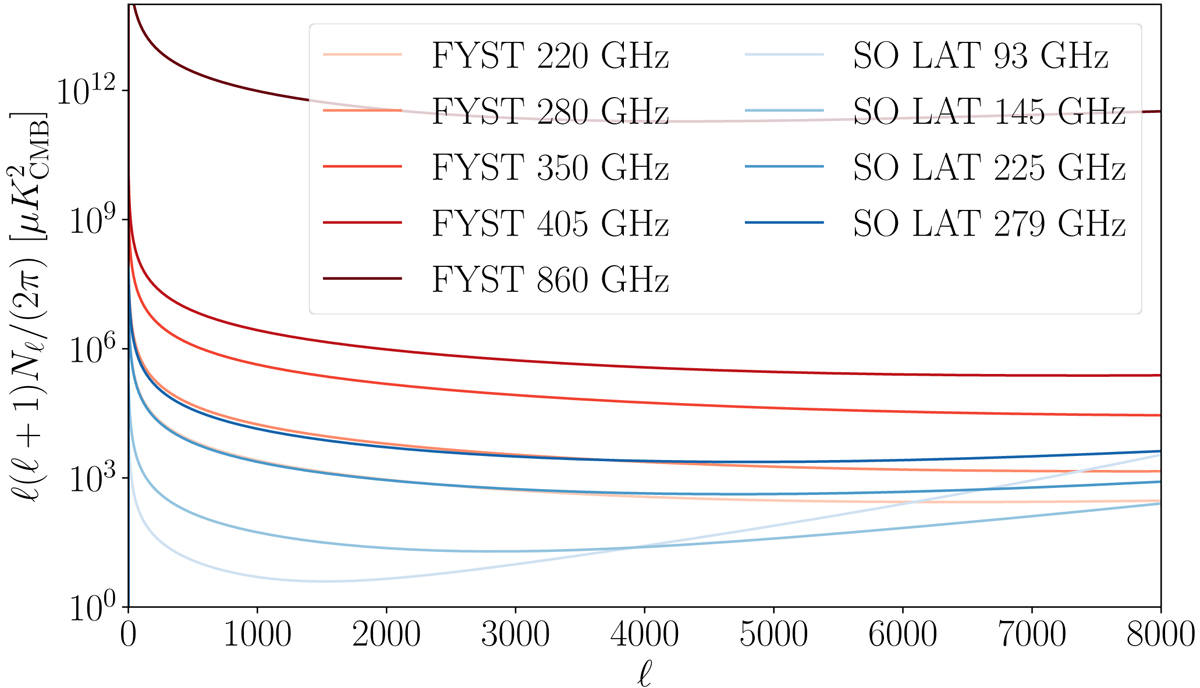
SO LAT (blue lines) and FYST (red lines) sum of the atmospheric red and instrumental white noise spectra based on the noise model presented by Ade et al. (2019) and adopted by Choi et al. (2020a). The noise curves have been beam corrected.
Current usage metrics show cumulative count of Article Views (full-text article views including HTML views, PDF and ePub downloads, according to the available data) and Abstracts Views on Vision4Press platform.
Data correspond to usage on the plateform after 2015. The current usage metrics is available 48-96 hours after online publication and is updated daily on week days.
Initial download of the metrics may take a while.