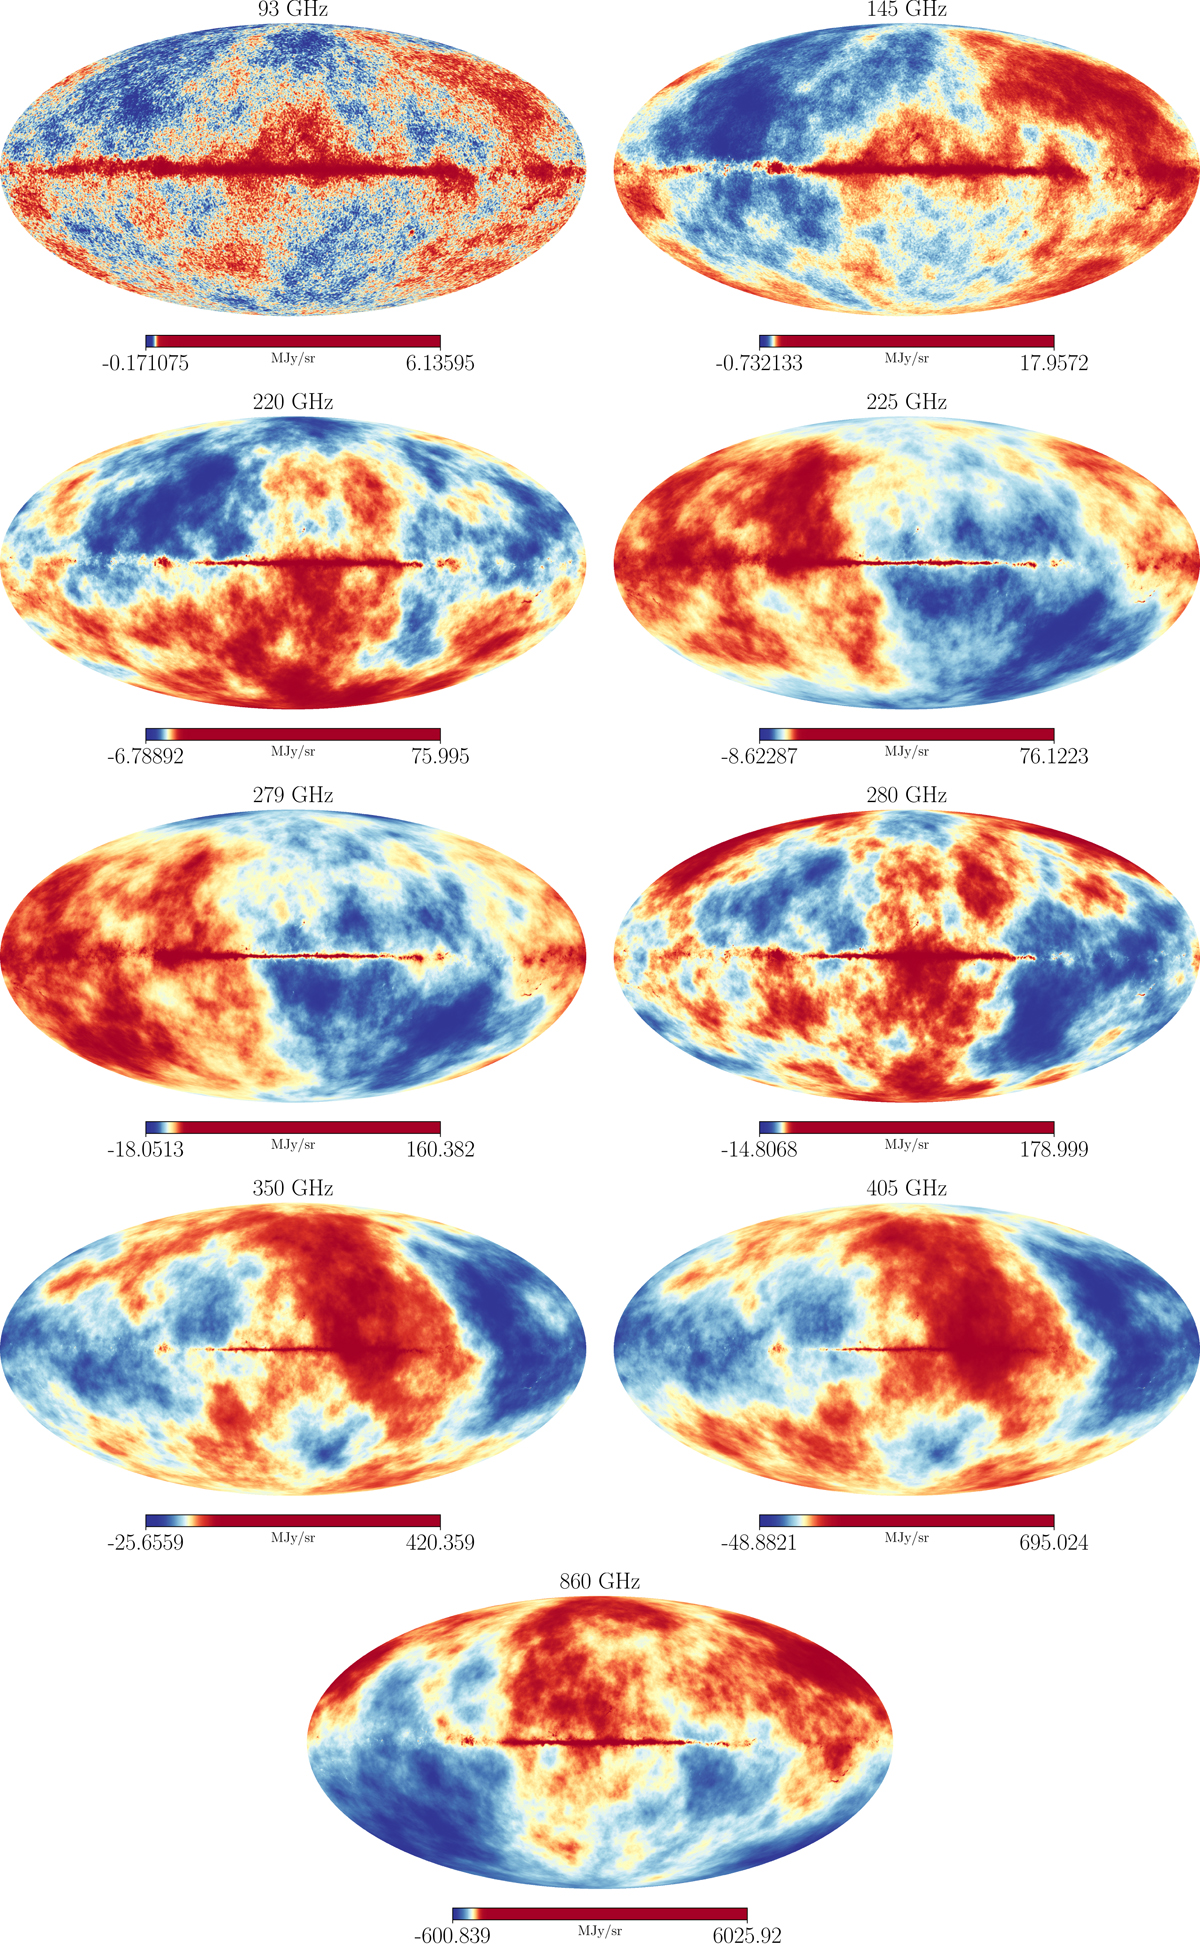
Fig. D.1.
Download original image
Mock HEALPy maps of the microwave sky simulated using the Skymodel pipeline (see Sec. 3). All Galactic foregrounds and extragalactic components (see Table 1) at the sensitivities, beam sizes, and frequencies of SO LAT and FYST (see Table 2) and the 90% correlated atmospheric red noise between neighbouring channels generated using the noise curves given by Choi et al. (2020a) were included (see Fig. 3).
Current usage metrics show cumulative count of Article Views (full-text article views including HTML views, PDF and ePub downloads, according to the available data) and Abstracts Views on Vision4Press platform.
Data correspond to usage on the plateform after 2015. The current usage metrics is available 48-96 hours after online publication and is updated daily on week days.
Initial download of the metrics may take a while.