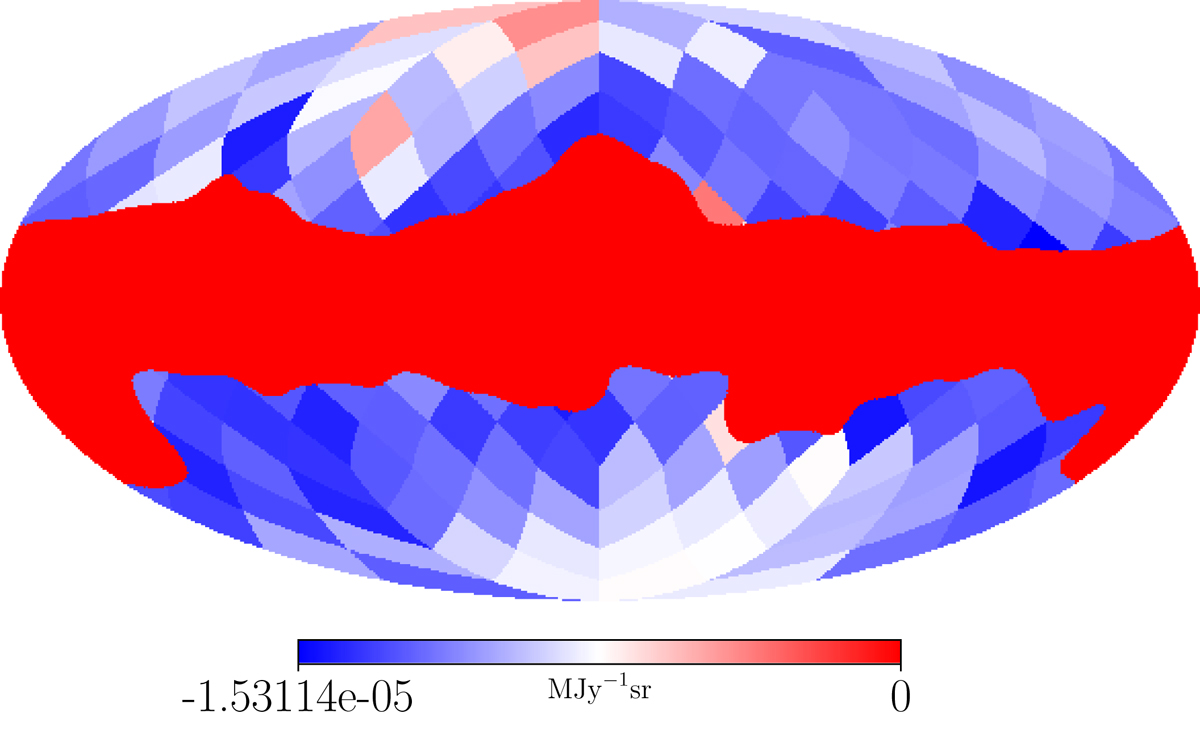
Fig. C.1.
Download original image
Maps of the weights for each patch of the sky where the ILC was applied for the 860 GHz frequency band. The weights were computed from simulations that included all Galactic foregrounds and extragalactic components (see Table 1) at the sensitivities, beam sizes, and frequencies of SO LAT and FYST (see Table 2) and with 90% correlated atmospheric red noise generated using the noise curves given by Choi et al. (2020a), (see Fig. 3).
Current usage metrics show cumulative count of Article Views (full-text article views including HTML views, PDF and ePub downloads, according to the available data) and Abstracts Views on Vision4Press platform.
Data correspond to usage on the plateform after 2015. The current usage metrics is available 48-96 hours after online publication and is updated daily on week days.
Initial download of the metrics may take a while.