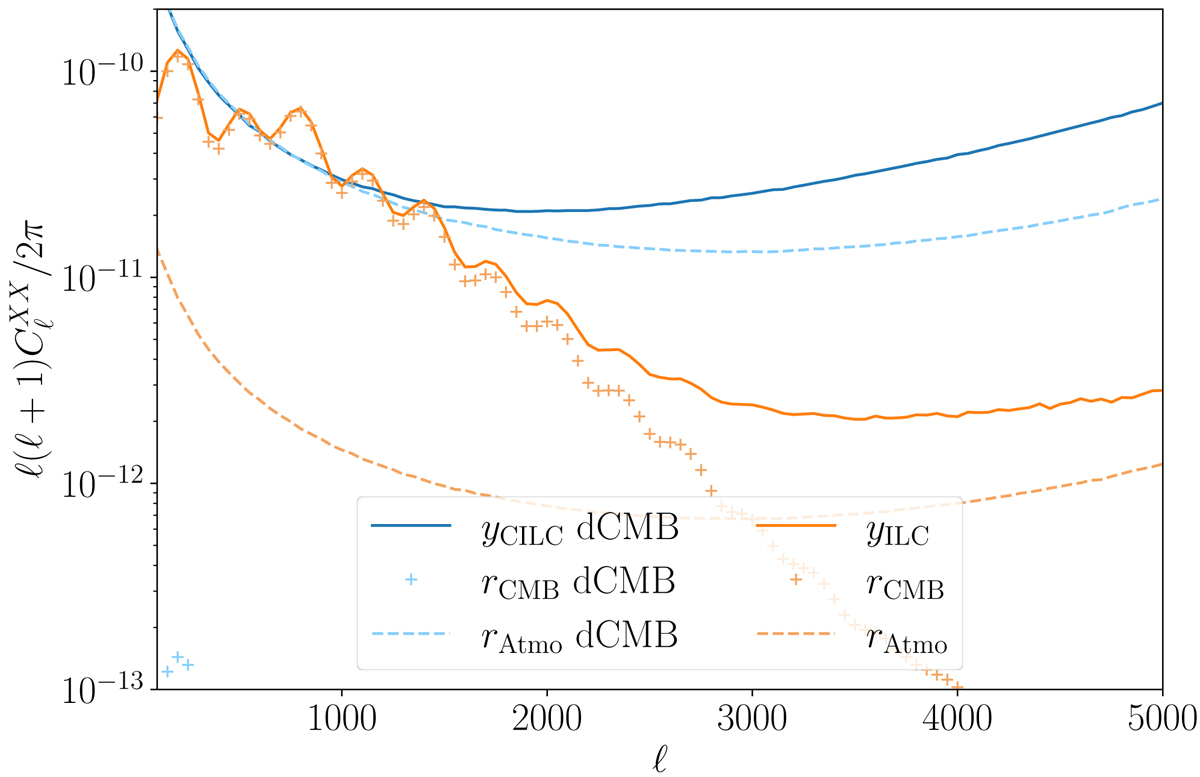
Fig. B.1.
Download original image
Power spectra of ILC/CILC (full lines) and their noise residuals (dotted lines). Specifically, the orange curve is the power spectrum of the ILC-extracted Compton-y map. The lighter orange lines are the noise residuals. Specifically, they are the ILC residual CMB noise (rCMB) and rAtmo for the atmospheric noise. The blue lines represent the case with CILC where the CMB is deprojected. The solid, darker blue curve is the power spectrum of the CILC-extracted Compton-y map. The lighter blue curves are the noise residuals.
Current usage metrics show cumulative count of Article Views (full-text article views including HTML views, PDF and ePub downloads, according to the available data) and Abstracts Views on Vision4Press platform.
Data correspond to usage on the plateform after 2015. The current usage metrics is available 48-96 hours after online publication and is updated daily on week days.
Initial download of the metrics may take a while.