Fig. A.2.
Download original image
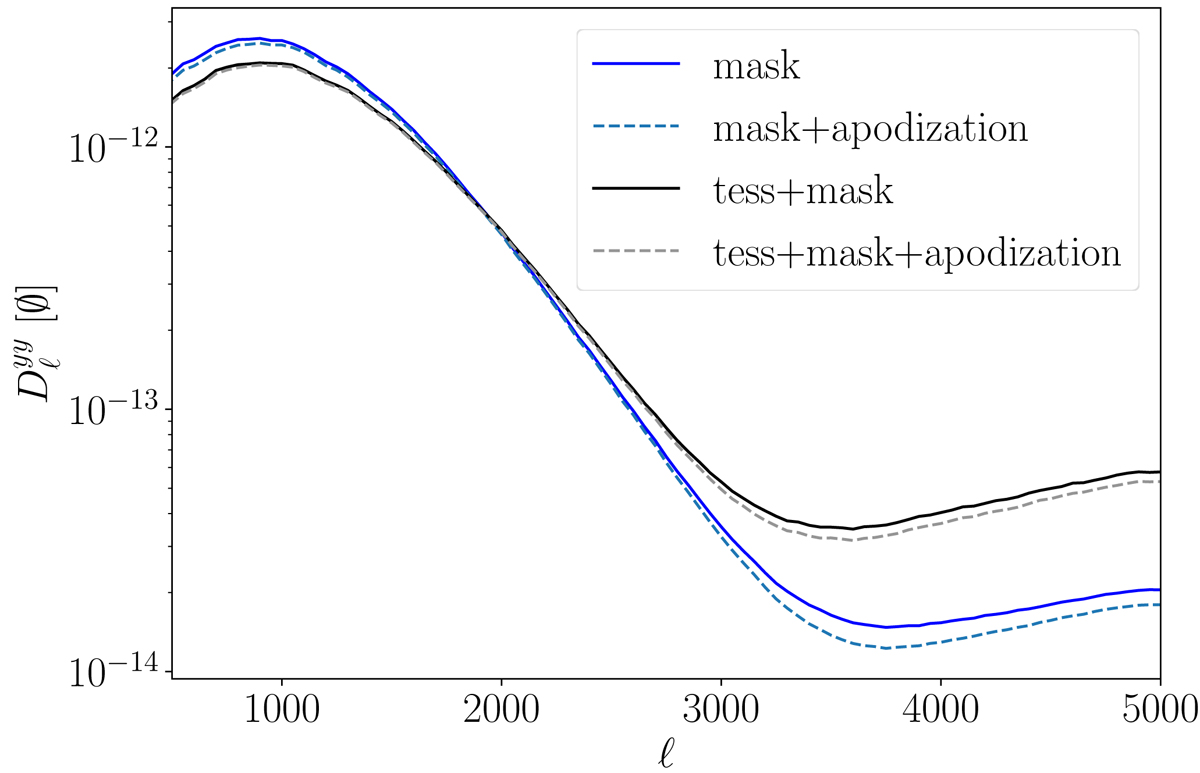
Power spectra of the Compton-y map using our ILC pipeline on Planck DR2 with different configurations. In blue is the power spectrum of the extracted map with a simple fsky = 0.6 Galactic mask. In black is the same thing but with a tessellation of the sky. The dotted lines (blue and black) indicate the inclusion of apodisation in each case.
Current usage metrics show cumulative count of Article Views (full-text article views including HTML views, PDF and ePub downloads, according to the available data) and Abstracts Views on Vision4Press platform.
Data correspond to usage on the plateform after 2015. The current usage metrics is available 48-96 hours after online publication and is updated daily on week days.
Initial download of the metrics may take a while.