Fig. 7
Download original image
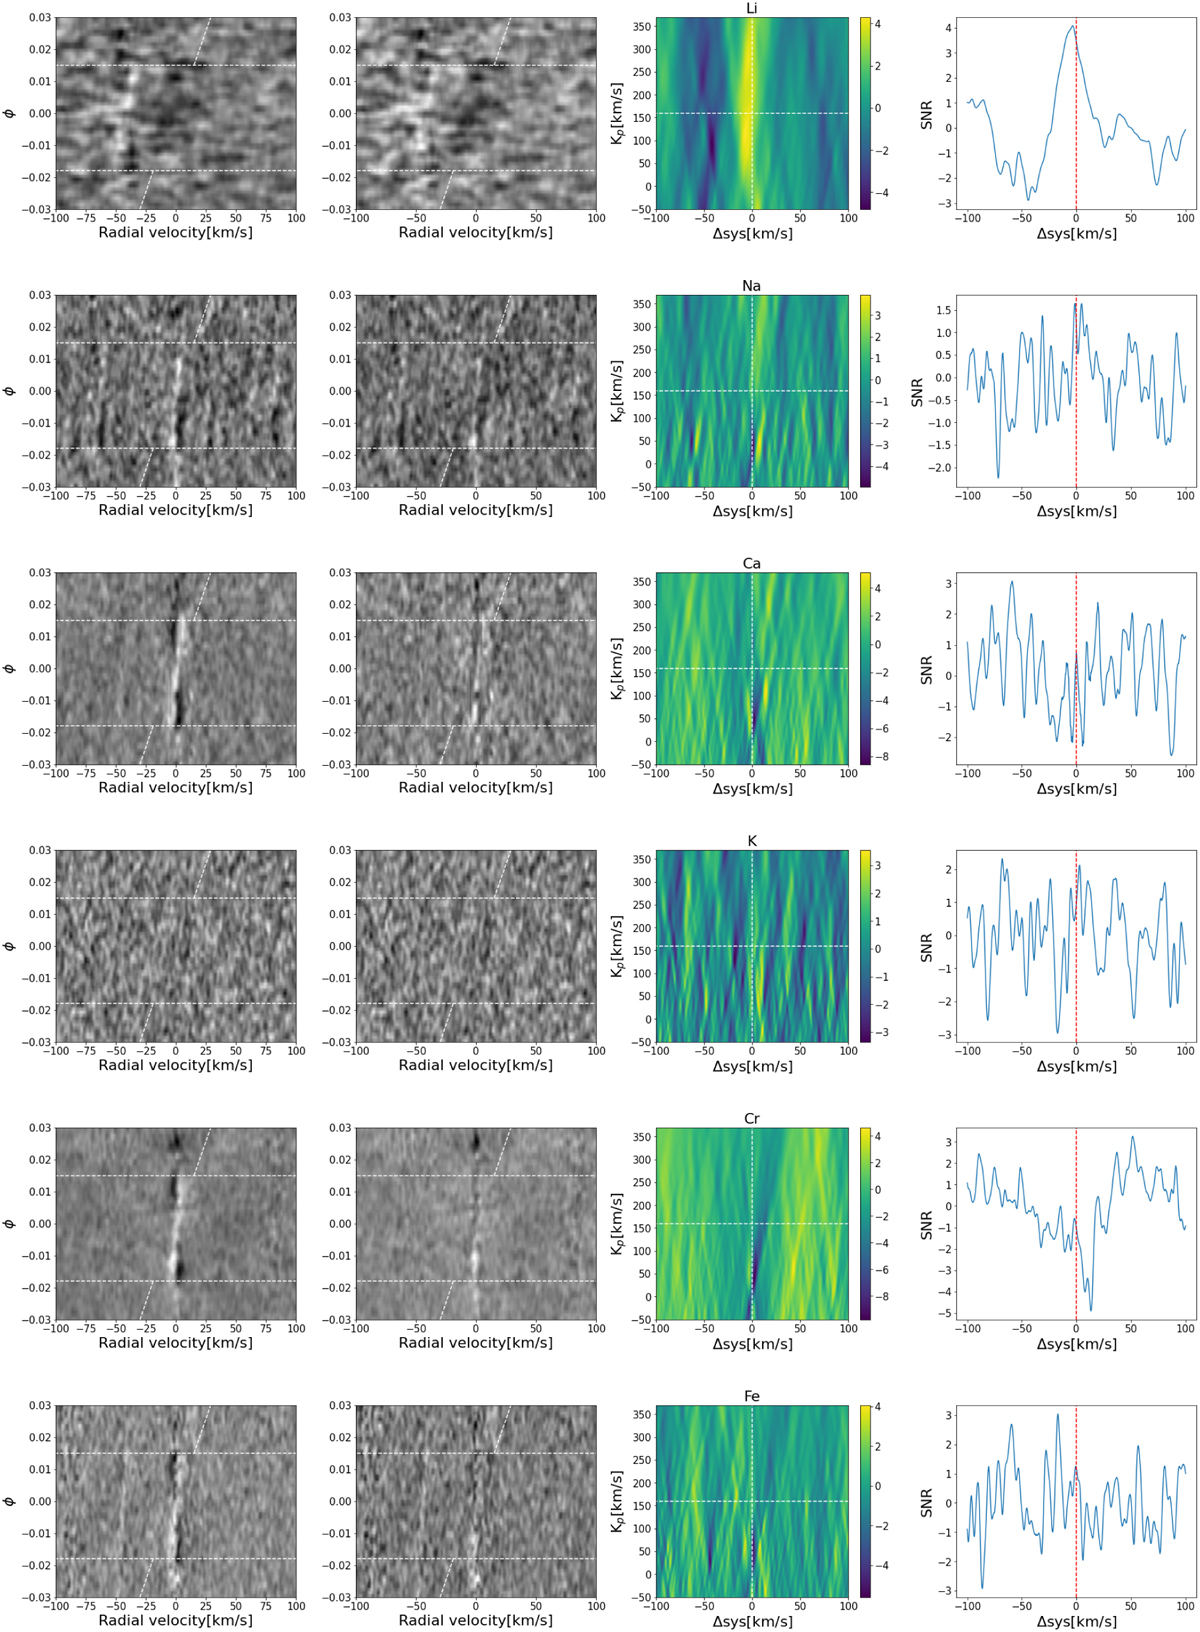
CCF results derived by cross-correlating the template spectra produced by petitRADTRANS with the observed transmission spectra. First panels: 2D CCF maps of Li I, Na I, Ca I, K I, Cr I, and Fe I with CLV+RM effects uncorrected. The white dotted lines mark the beginning and ending position of the transit, and the inclined white lines indicate the expected trace of signal from the planet. Second panels: same as the first panels but with CLV+RM effects corrected. Third panels: Kp-ΔVsys maps in the range of −50 ∼ 350 km s−1. The signal is expected to appear around the intersection of two white dotted lines. Fourth panels: S/N plots at the expected Kp position.
Current usage metrics show cumulative count of Article Views (full-text article views including HTML views, PDF and ePub downloads, according to the available data) and Abstracts Views on Vision4Press platform.
Data correspond to usage on the plateform after 2015. The current usage metrics is available 48-96 hours after online publication and is updated daily on week days.
Initial download of the metrics may take a while.