Open Access
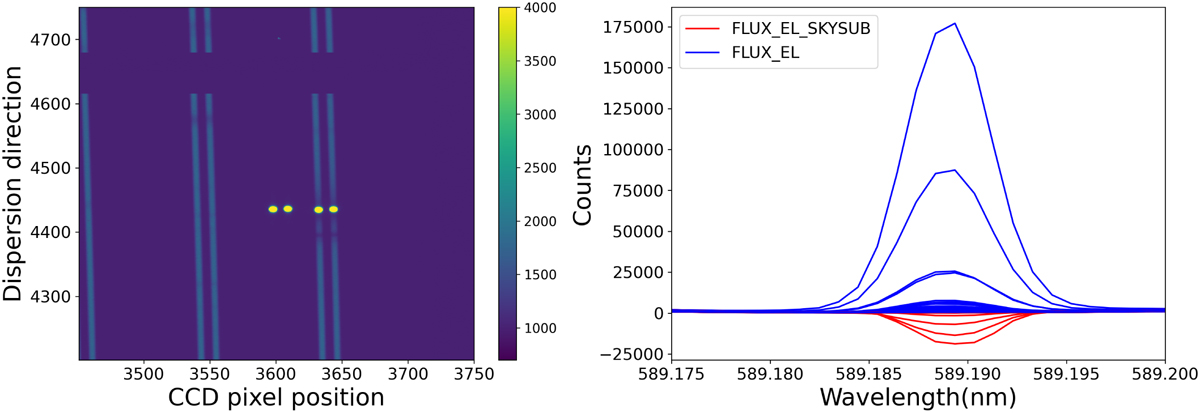
Fig. A.7
Download original image
Na I D2 absorption line shown in the raw data image of T1 appears to be contaminated by two bright spikes which leads to the abnormal flux around Na I D2 line (left). Plot of the abnormal counts of no sky-subtracted flux colored in blue and sky-subtracted flux shown in red (right).
Current usage metrics show cumulative count of Article Views (full-text article views including HTML views, PDF and ePub downloads, according to the available data) and Abstracts Views on Vision4Press platform.
Data correspond to usage on the plateform after 2015. The current usage metrics is available 48-96 hours after online publication and is updated daily on week days.
Initial download of the metrics may take a while.