Fig. A.5
Download original image
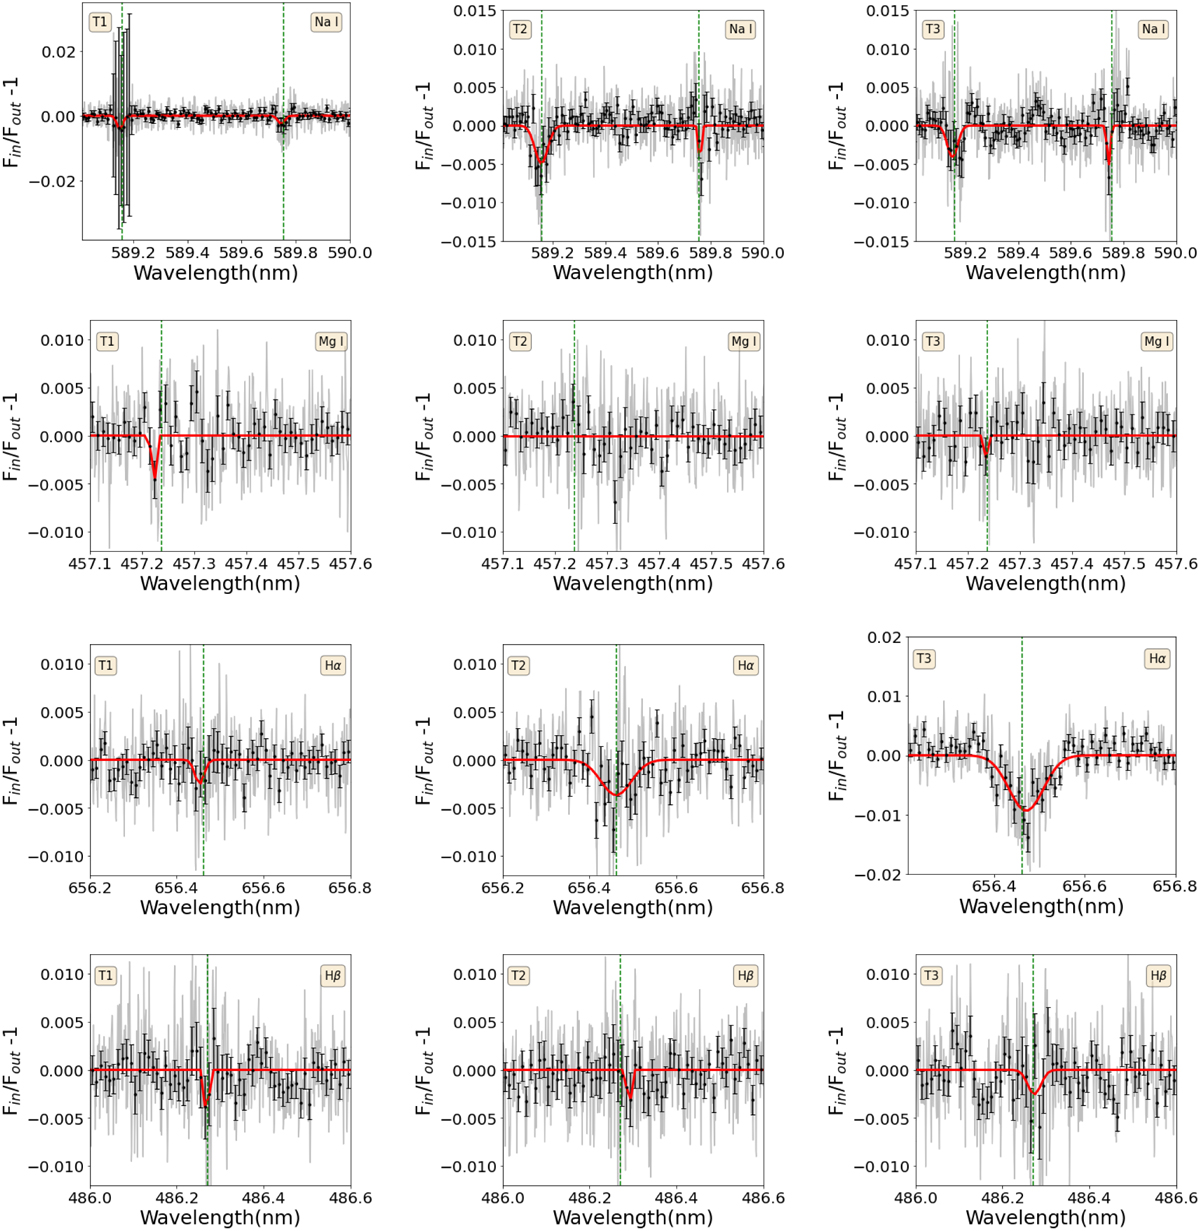
Transmission spectra of Na I, Mg I, Hα, and Hβ for each night. Left (T1), middle (T2), and right (T3). The grey line represents the raw transmission spectra in the PRF which has been corrected for CLV+RM effects, The black dotted line represents the binned spectra of 0.1 Å and the Gaussian fitting is shown in red line. The dashed green vertical line represent the static position of atom individual line at vacuum wavelength.
Current usage metrics show cumulative count of Article Views (full-text article views including HTML views, PDF and ePub downloads, according to the available data) and Abstracts Views on Vision4Press platform.
Data correspond to usage on the plateform after 2015. The current usage metrics is available 48-96 hours after online publication and is updated daily on week days.
Initial download of the metrics may take a while.