Fig. A.4
Download original image
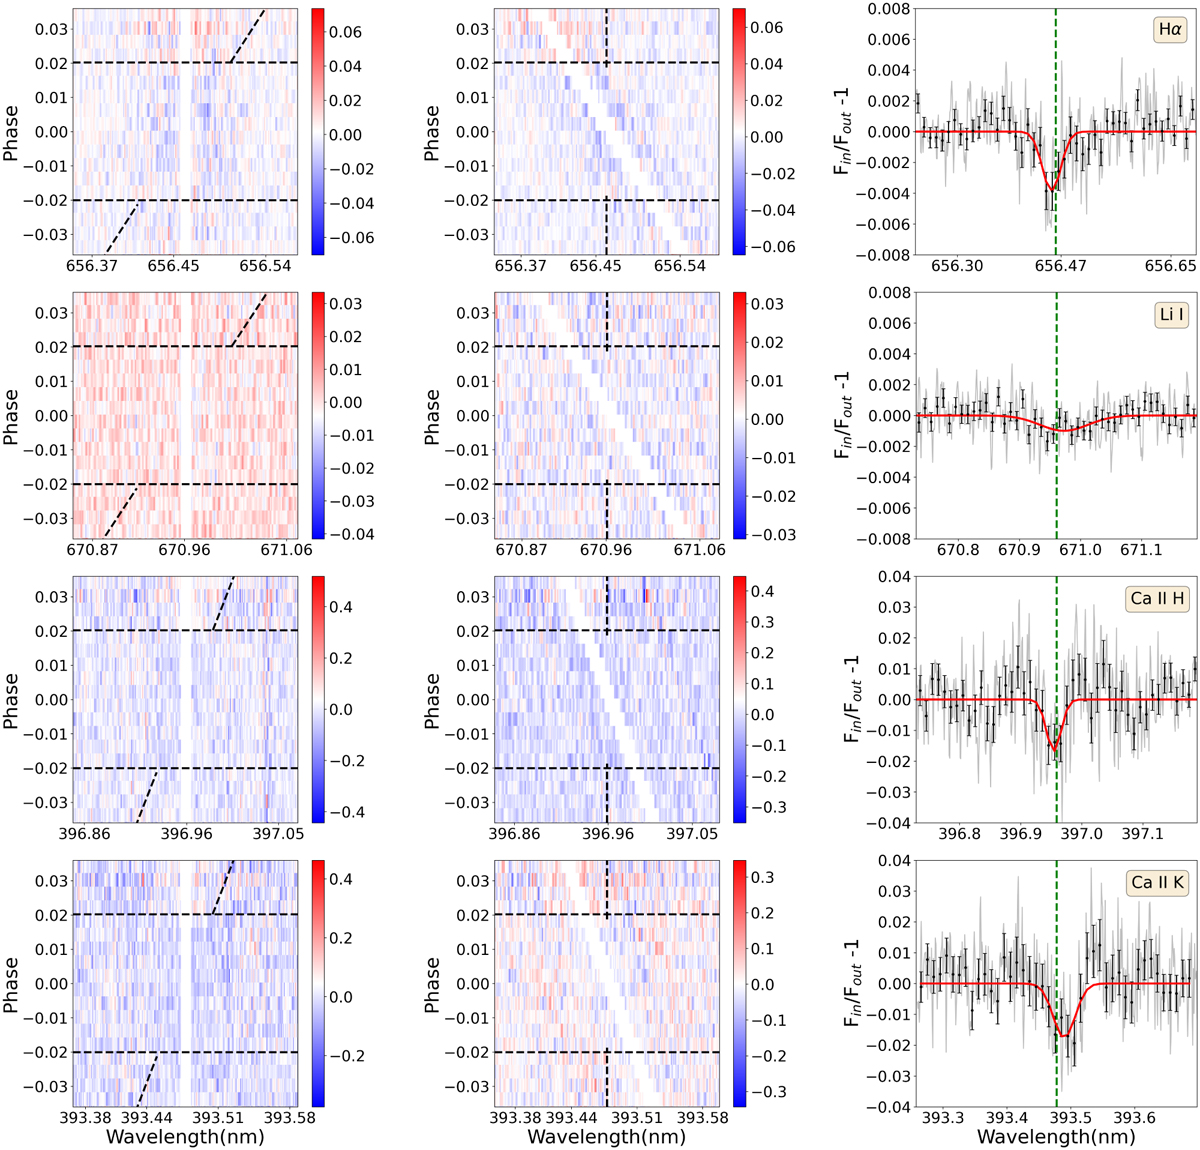
Masked phase-resolved 2D transmission spectra based on the combination of three nights for Hα, Li I, Ca II H, and Ca II K lines with RM+CLV correction applied in the left panel. The horizontal black-dashed lines indicate the beginning and end of the transit. The inclined black-dashed line presents the expected trace of signal from the exoplanet atmosphere. The middle panels show the 2D transmission spectra in the planetary rest frame (PRF) assuming Kp = 159.76 km s−1. In the right panels, the integrated transmission spectra in PRF with the CLV+RM effects corrected are shown in grey (original) and black (binned) and the best Gaussian fit are shown in red. The dashed green vertical line represents the static position of each line at vacuum wavelength.
Current usage metrics show cumulative count of Article Views (full-text article views including HTML views, PDF and ePub downloads, according to the available data) and Abstracts Views on Vision4Press platform.
Data correspond to usage on the plateform after 2015. The current usage metrics is available 48-96 hours after online publication and is updated daily on week days.
Initial download of the metrics may take a while.