Fig. A.1
Download original image
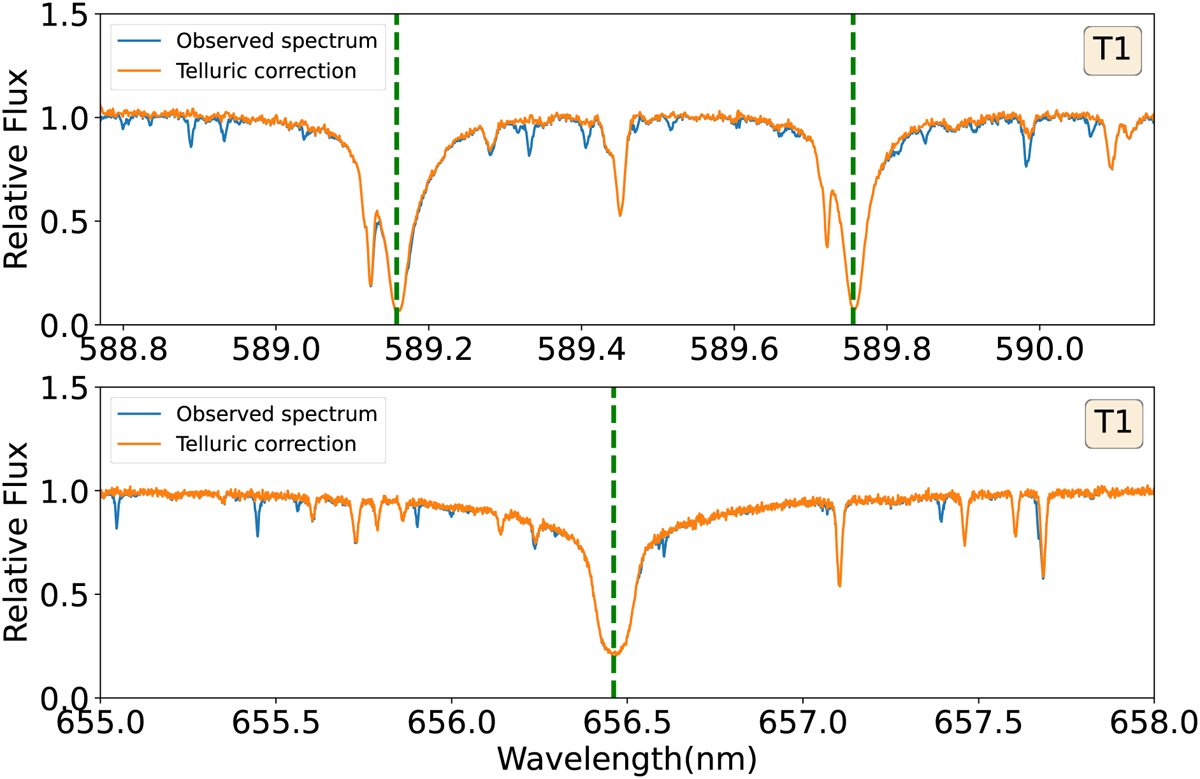
Effect of a telluric correction using Molecfit software in the observed spectrum of WASP-85Ab on the night of 2021 Feb 13 (T1) for single exposure. The observed spectrum is shown in blue line and the spectrum after telluric correction is shown in orange line. The dashed green vertical line represent the static position of atom spectral line at vacuum wavelength. Top panel: Telluric correction of spectral line around Na D1 & D2 lines. Bottom panel: Telluric correction of spectral line around the Hα lines.
Current usage metrics show cumulative count of Article Views (full-text article views including HTML views, PDF and ePub downloads, according to the available data) and Abstracts Views on Vision4Press platform.
Data correspond to usage on the plateform after 2015. The current usage metrics is available 48-96 hours after online publication and is updated daily on week days.
Initial download of the metrics may take a while.