Fig. 6
Download original image
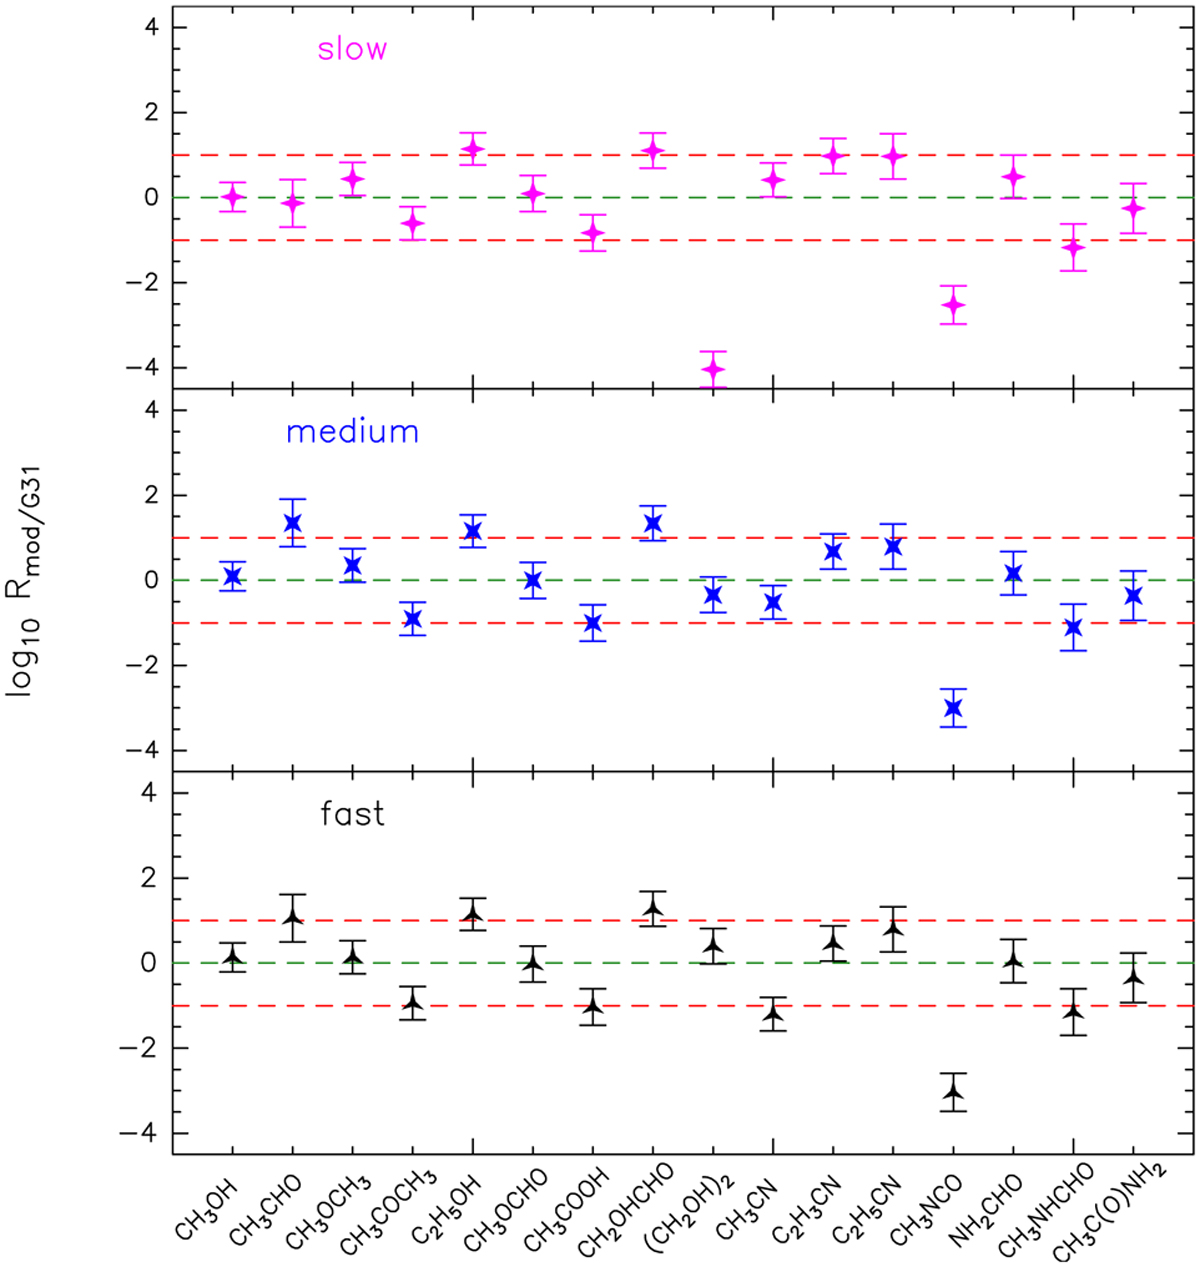
Ratio of abundances from model by Garrod et al. (2022) to abundances derived for G31. The three panels use the abundances of the three different warm-up timescale chemical models. An error of 30% is considered on the values of the abundances from the chemical models. The green dashed line represents a ratio Rmod/G31 = 1, while the two red dashed lines represent Rmod/G31 = 0.1 and 10.
Current usage metrics show cumulative count of Article Views (full-text article views including HTML views, PDF and ePub downloads, according to the available data) and Abstracts Views on Vision4Press platform.
Data correspond to usage on the plateform after 2015. The current usage metrics is available 48-96 hours after online publication and is updated daily on week days.
Initial download of the metrics may take a while.