Fig. 5
Download original image
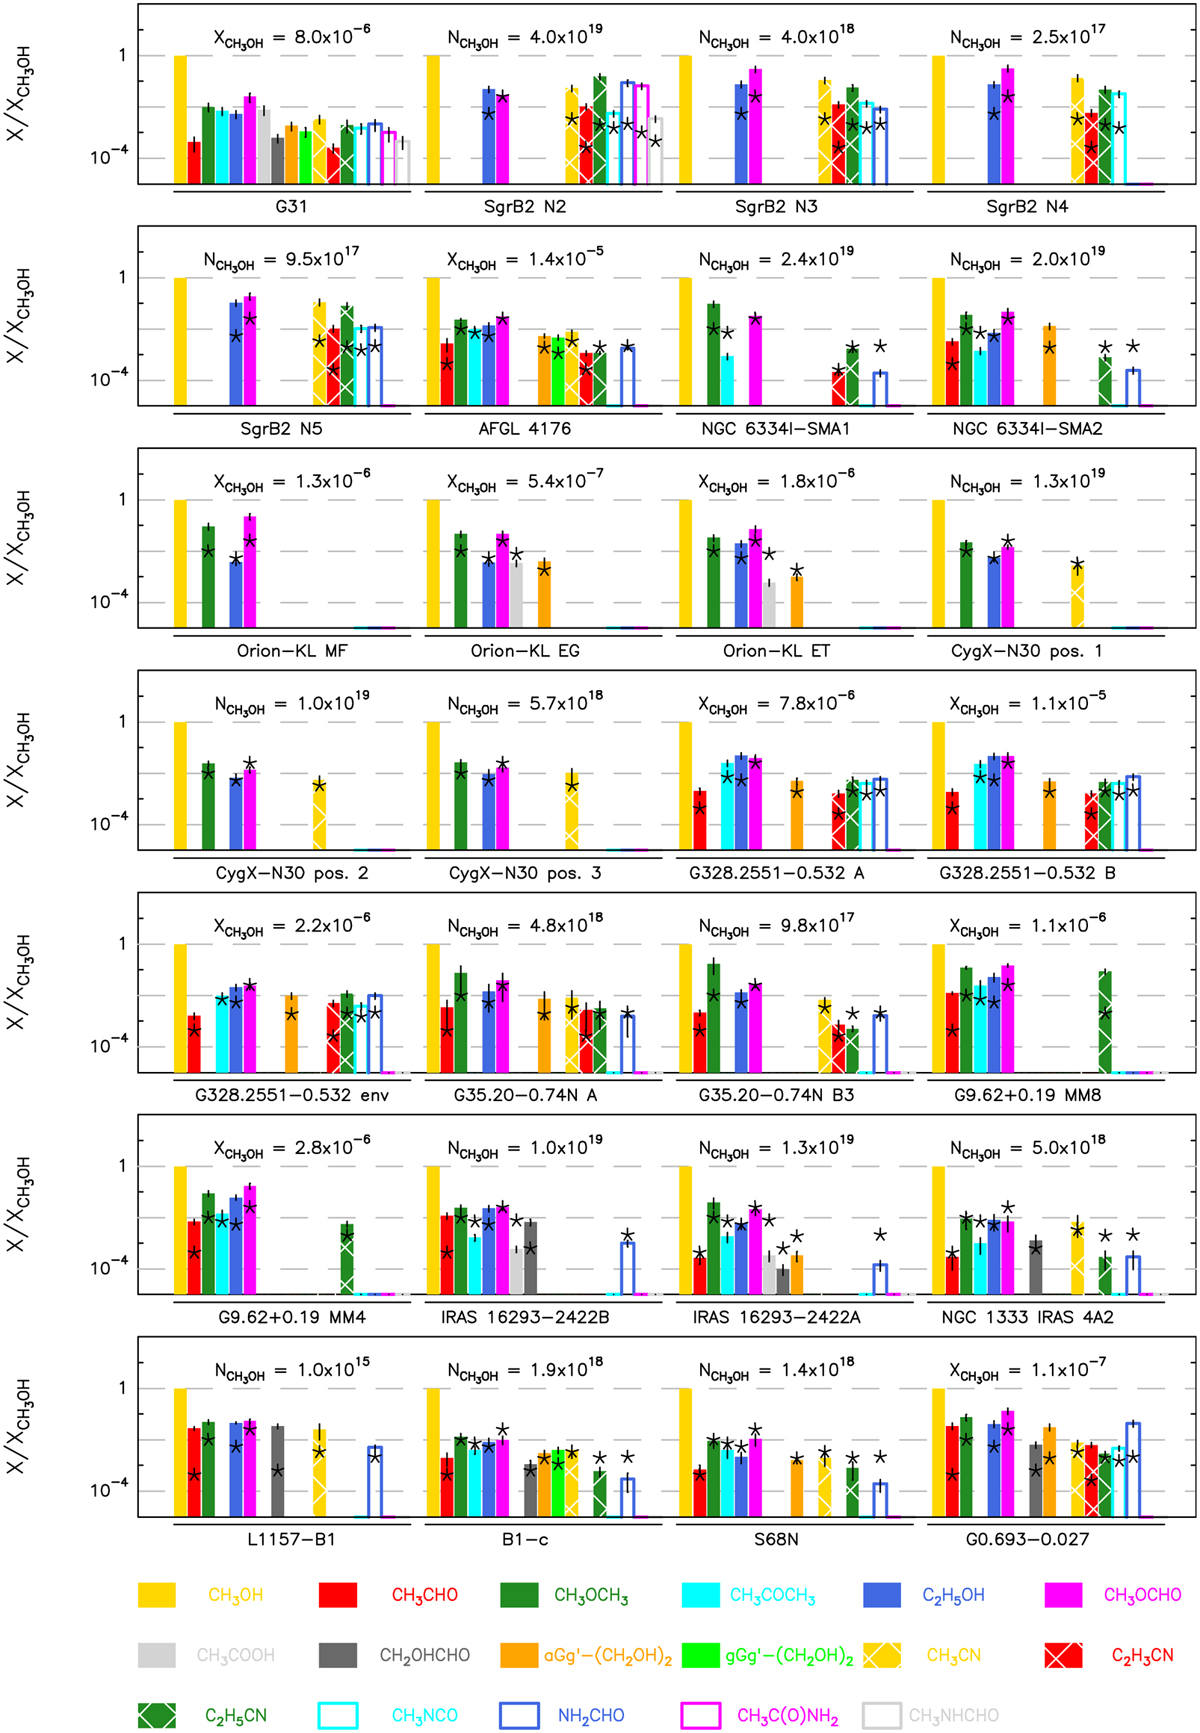
Histograms of O-bearing, N-bearing, and O- and N-bearing COMs abundances with respect to methanol for G31 (this paper, Mininni et al. 2020, and Colzi et al. 2021); SgrB2-N2/N3/N4/N5; AFGL4176; NGC 6334I-SMA1 and SMA2 (from SMA data analysis); Orion-KL methyl formate peak (MF), ethylene glycol peak (EG), and ethanol peak (ET); CygX-N30 at the position 1, 2, and 3 as described in van der Walt et al. (2021); G328.2551-0.532 A, B, and inner-envelope position as in Csengeri et al. (2019); G35.20-0.74N A and B3; IRAS 16293-2422 A and B; NGC 1333 IRAS 4A2; L1157-B1; B1-c; S68N; and G+0.693-0.027. For the sources whose abundances were not available the ratio of column densities is plotted since ![]() . In the upper part of each panel are reported the absolute values of
. In the upper part of each panel are reported the absolute values of ![]() (or
(or ![]() in cm−2, if the abundance is not available) for each source. To better compare the different sources with G31, the values of
in cm−2, if the abundance is not available) for each source. To better compare the different sources with G31, the values of ![]() in G31 are flagged with asterisks above the histogram of all the other sources.
in G31 are flagged with asterisks above the histogram of all the other sources.
Current usage metrics show cumulative count of Article Views (full-text article views including HTML views, PDF and ePub downloads, according to the available data) and Abstracts Views on Vision4Press platform.
Data correspond to usage on the plateform after 2015. The current usage metrics is available 48-96 hours after online publication and is updated daily on week days.
Initial download of the metrics may take a while.