Fig. 3
Download original image
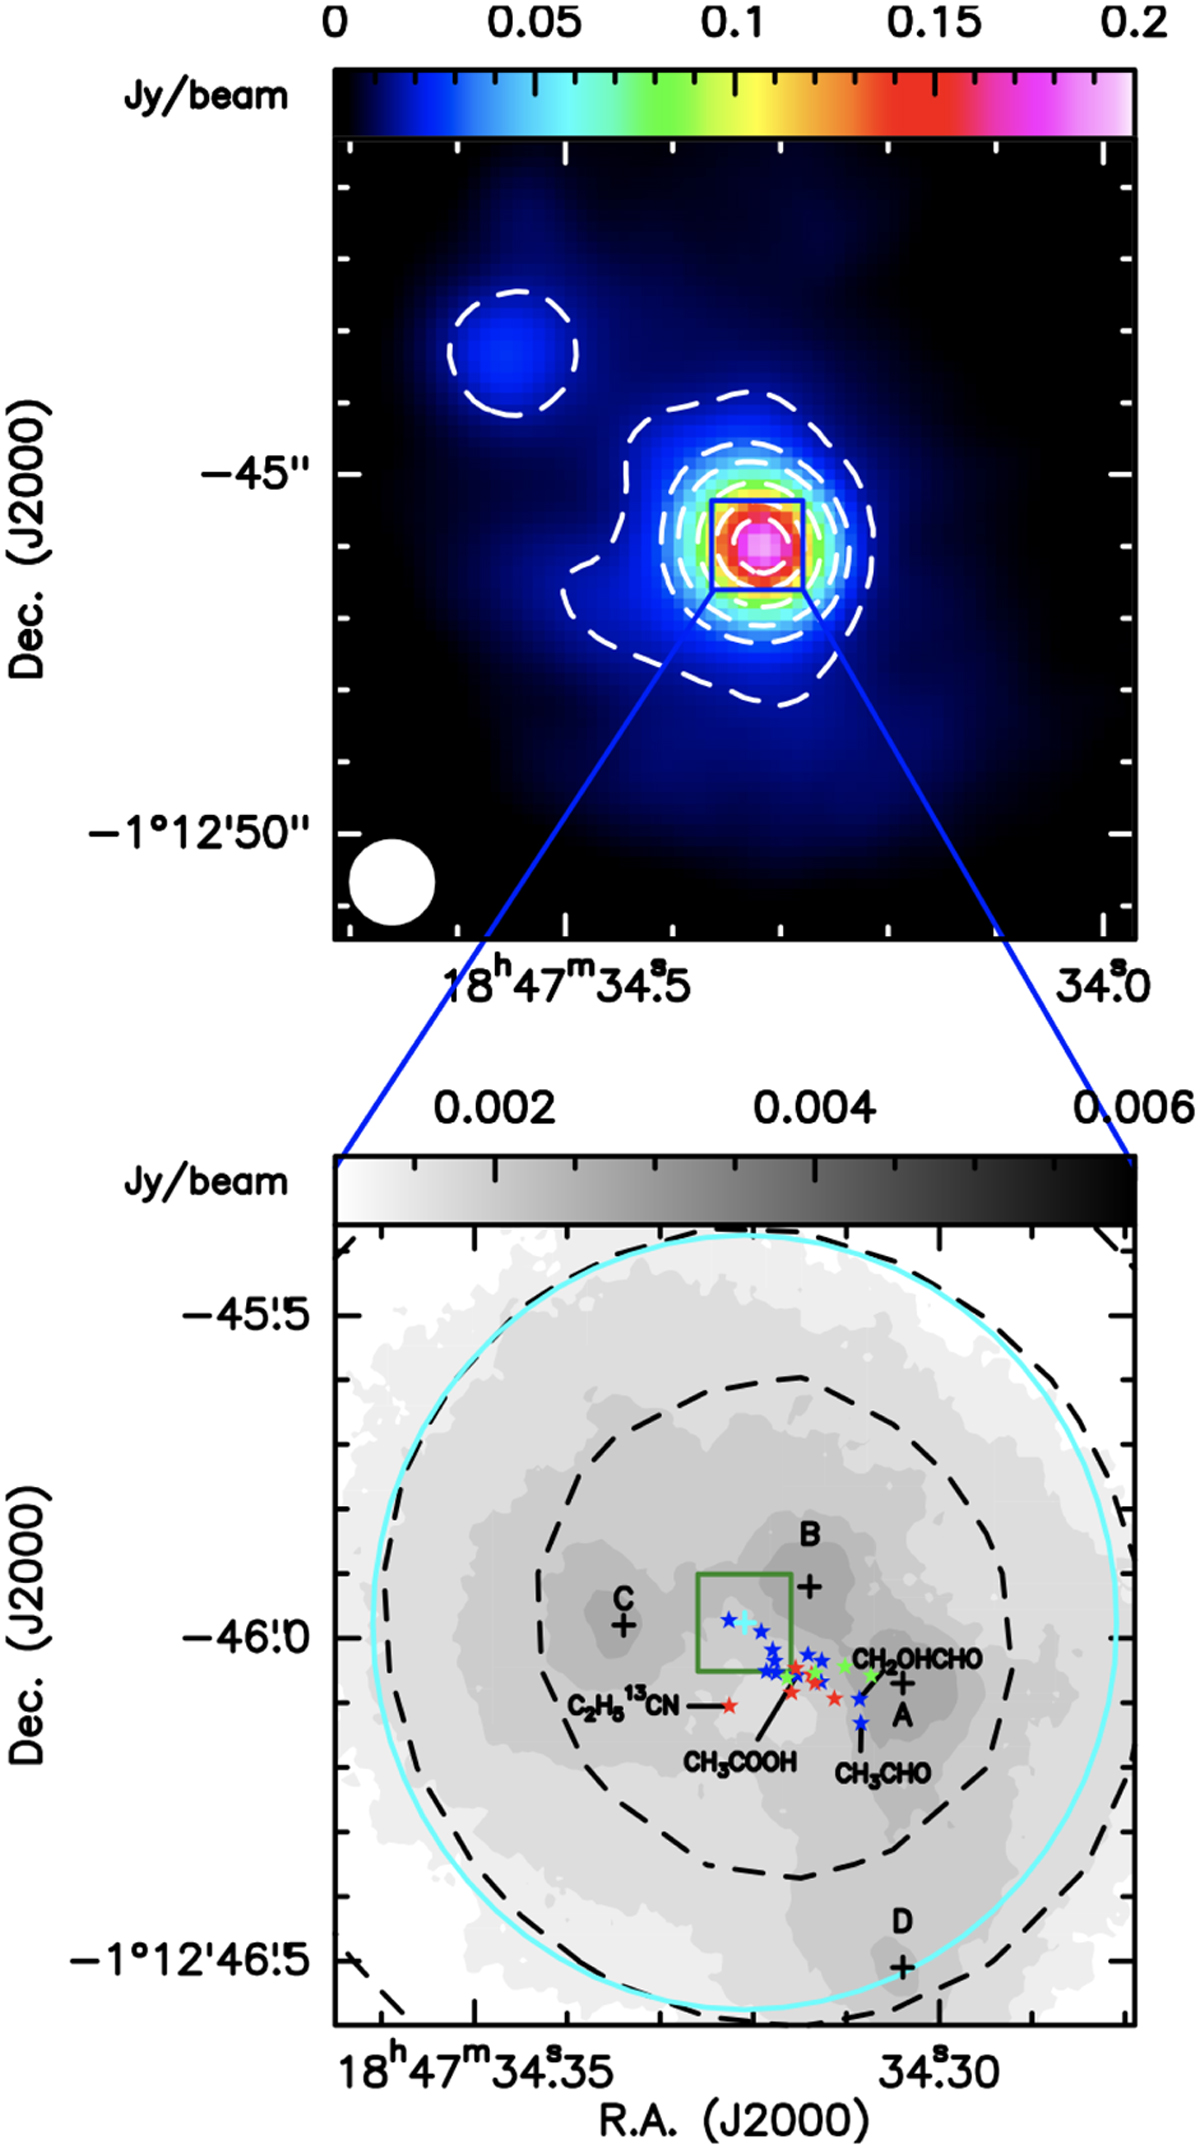
Position of molecular emission peak over continuum map of G31. Upper panel: Continuum map from Mininni et al. (2020). The beam of 1.″2 of the GUAPOS data is given in the lower left corner. The contour levels are at 20, 40, 60, 100, 150, and 200 times the value of rms = 0.8 mJy beam−1. Lower panel: Zoomed-in image of upper panel, where the black dashed contours are the two inner contours (150 and 200 times the rms) of the continuum image from the GUAPOS data at a resolution of 1.″2, while the grayscale map (0.08, 0.12, 0.2, 0.4 mJy beam−1) is the continuum map at 3.5 mm from Beltrán et al. (2021) with an angular resolution of ~0.″075. The dimension of the beam is given in the lower left corner, while the 1.″2 beam of the GUAPOS data is shown as the cyan circular contour. The four black crosses give the positions of the four compact sources detected by Beltrán et al. (2021), and the green square indicates the dimension of the pixel in the GUAPOS maps and cubes, centered around the position of the peak of the GUAPOS continuum, indicated by the cyan cross. The blue stars indicate the positions of the peak of the emission of O-bearing species, red stars indicate the positions of the peak of the emission of N-bearing species, and green stars indicate the positions of the peak of the emission of O- and N-bearing species. The errors of the positions of the peak of molecular species are comparable to or below the dimension of the star symbols.
Current usage metrics show cumulative count of Article Views (full-text article views including HTML views, PDF and ePub downloads, according to the available data) and Abstracts Views on Vision4Press platform.
Data correspond to usage on the plateform after 2015. The current usage metrics is available 48-96 hours after online publication and is updated daily on week days.
Initial download of the metrics may take a while.