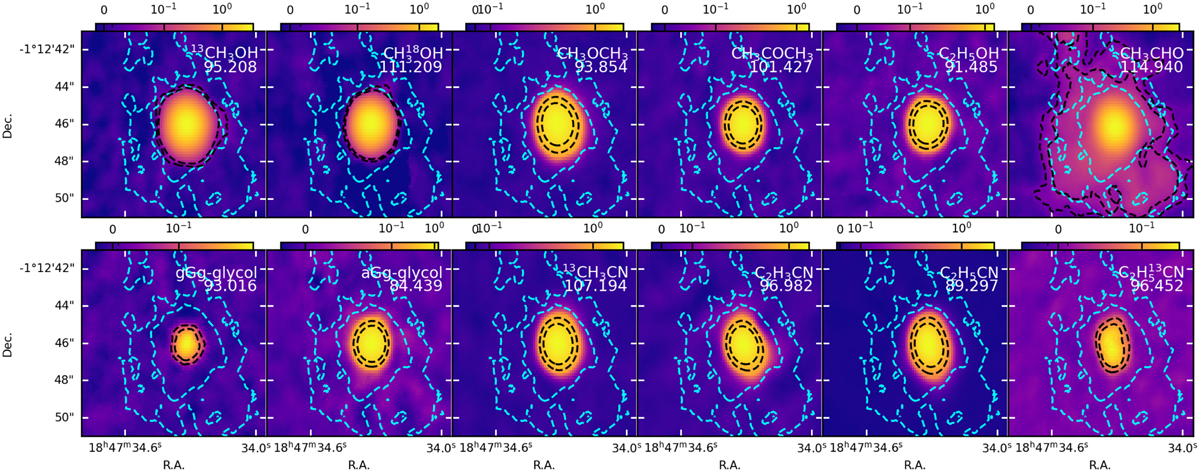
Fig. D.1
Download original image
Moment-0 maps of low-energy transitions for the molecular species analyzed in this paper. We do not include CH3OH vt=l, CH3CN v8=l, and ![]() since there were no available transitions with
since there were no available transitions with ![]() The moment-0 maps are not normalized to the peak intensity (i.e., to 1, as done for the mean maps shown in Fig. 1). The units are Jy/beamkms−1. The black dashed contours are the 5rms and l0rms contour of the color-scale image, while the cyan dashed contours are the 5rms and l0rms contours of the mean map of CH3CHO shown in Fig. 1.
The moment-0 maps are not normalized to the peak intensity (i.e., to 1, as done for the mean maps shown in Fig. 1). The units are Jy/beamkms−1. The black dashed contours are the 5rms and l0rms contour of the color-scale image, while the cyan dashed contours are the 5rms and l0rms contours of the mean map of CH3CHO shown in Fig. 1.
Current usage metrics show cumulative count of Article Views (full-text article views including HTML views, PDF and ePub downloads, according to the available data) and Abstracts Views on Vision4Press platform.
Data correspond to usage on the plateform after 2015. The current usage metrics is available 48-96 hours after online publication and is updated daily on week days.
Initial download of the metrics may take a while.