Fig. 2
Download original image
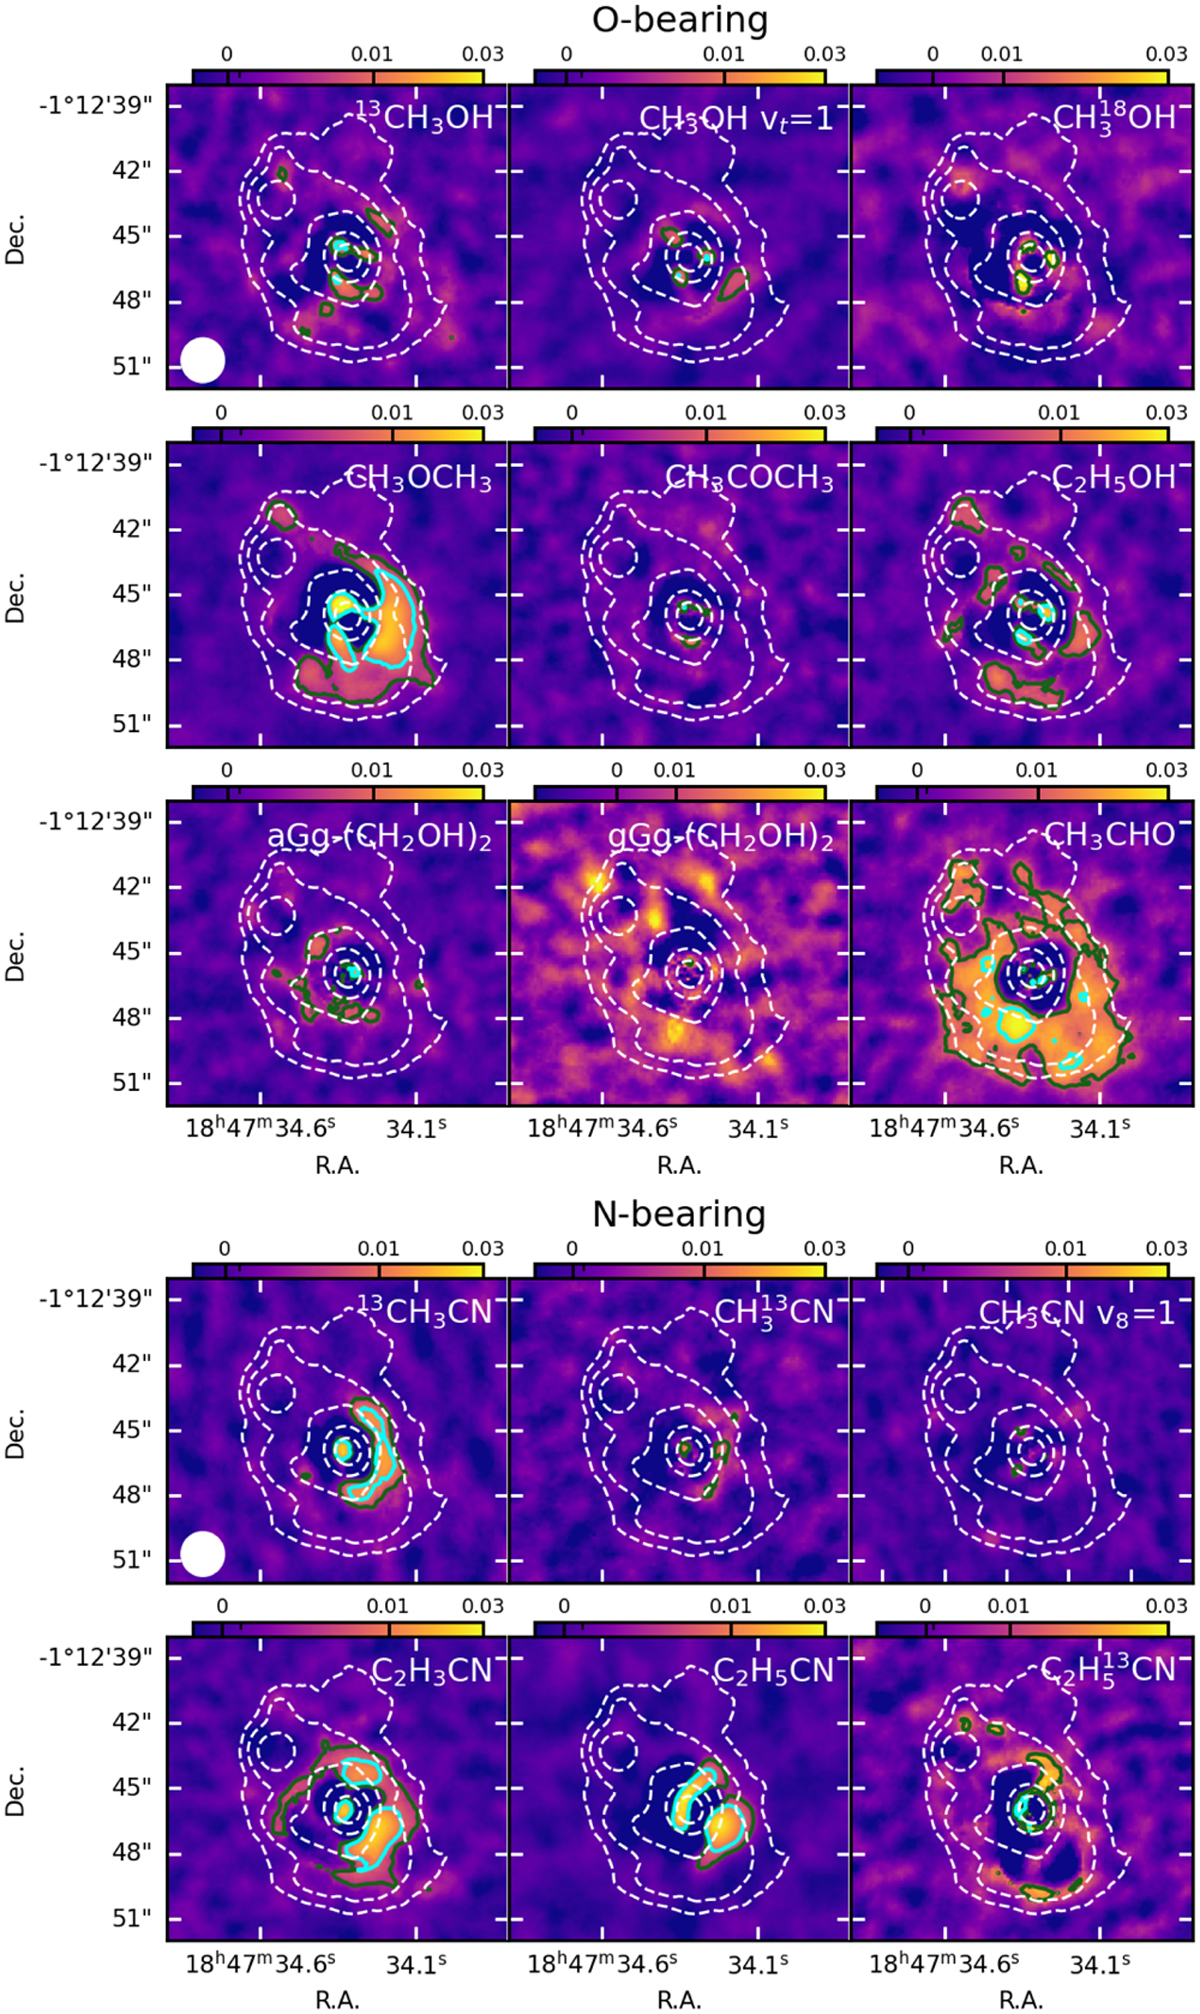
Maps of residuals after the 2D Gaussian fit to the mean maps for the species for which the analysis is presented in this work for the first time (see Table 1). The size of the plotted region is larger than that plotted in Fig. 1. The units are the arbitrary units of the mean maps. In white are plotted the contour levels of the continuum map at 150, 60, 20, 10, and 5 times the value of rms = 0.8 mJy beam−1 (from Mininni et al. 2020). The green and cyan solid lines delimit the contours of the regions where the emission in the residual map is larger than 5 and 10 times the rms, respectively. The size of the 1.″2 beam is indicated in the lower left corner of the top left panel.
Current usage metrics show cumulative count of Article Views (full-text article views including HTML views, PDF and ePub downloads, according to the available data) and Abstracts Views on Vision4Press platform.
Data correspond to usage on the plateform after 2015. The current usage metrics is available 48-96 hours after online publication and is updated daily on week days.
Initial download of the metrics may take a while.