Open Access
Fig. 4
Download original image
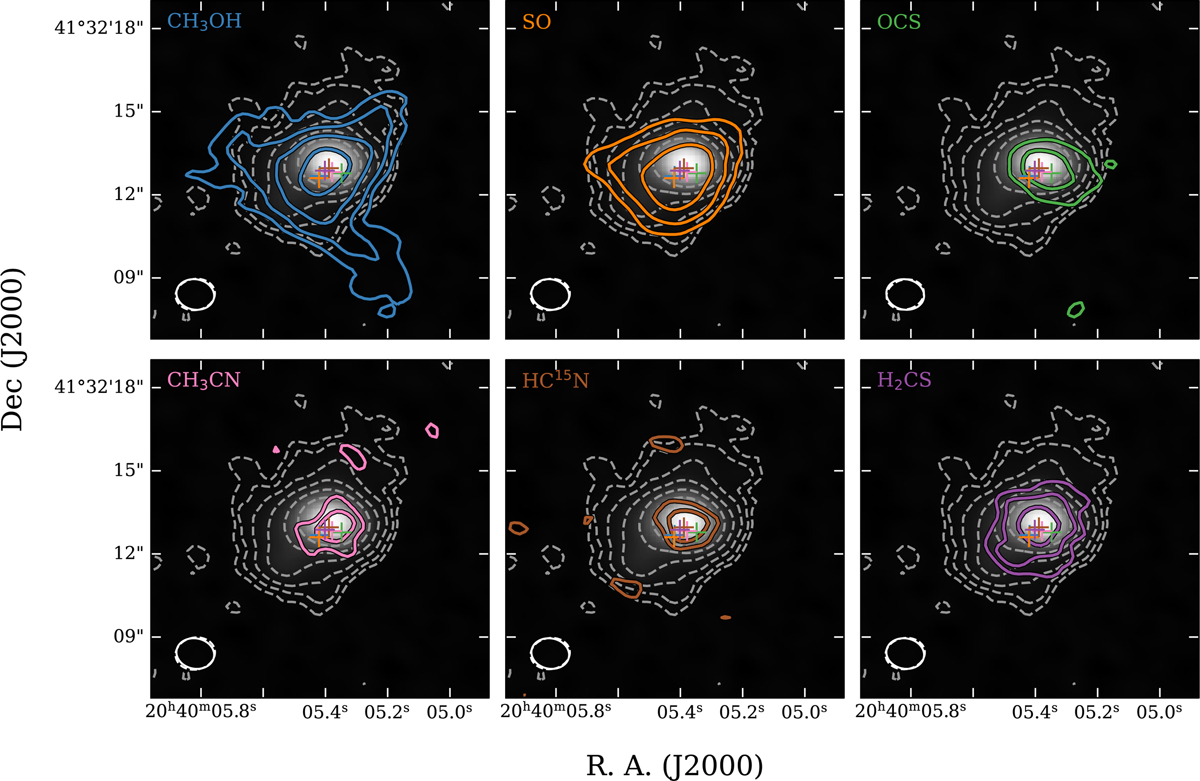
Molecules observed towards N63. The contour levels for both the continuum (grey dashed lines) and molecular emission (coloured) are 3, 6, 12, 24 and 48σ. The pluses are the molecular emission peak positions derived from 2D Gaussian fits (Table 5), and these are colour-coded according to molecule.
Current usage metrics show cumulative count of Article Views (full-text article views including HTML views, PDF and ePub downloads, according to the available data) and Abstracts Views on Vision4Press platform.
Data correspond to usage on the plateform after 2015. The current usage metrics is available 48-96 hours after online publication and is updated daily on week days.
Initial download of the metrics may take a while.