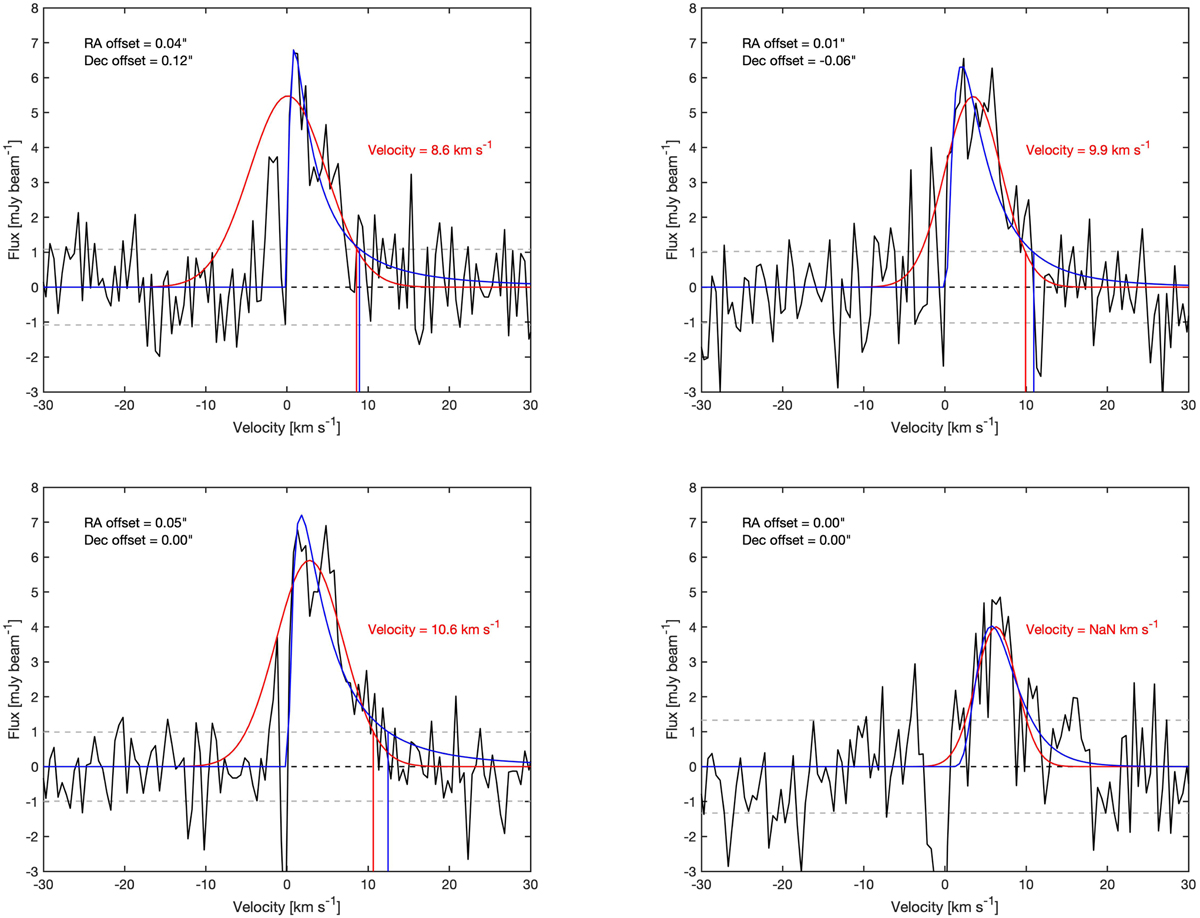
Fig. A.3
Download original image
Gaussian (red) and log-normal (blue) fits to the emission (black) in four different example positions at native spatial resolution. Note: the sign of the velocity scale has been changed and corrected w.r.t. υLSR in order to capture a lower limit on the infall velocity for each position. The log-normal fits generally provide slightly higher velocity estimates (vertical blue lines) than the Gaussian fits (vertical red lines). The σ level for each spectrum is indicated with a light grey dashed line and is calculated in the line emission free regions. Estimated velocities from the Gaussian fits for each of the spectra are indicated with red text. Note: the fit towards the central position is considered to be too poor for further analysis.
Current usage metrics show cumulative count of Article Views (full-text article views including HTML views, PDF and ePub downloads, according to the available data) and Abstracts Views on Vision4Press platform.
Data correspond to usage on the plateform after 2015. The current usage metrics is available 48-96 hours after online publication and is updated daily on week days.
Initial download of the metrics may take a while.