Fig. A.2
Download original image
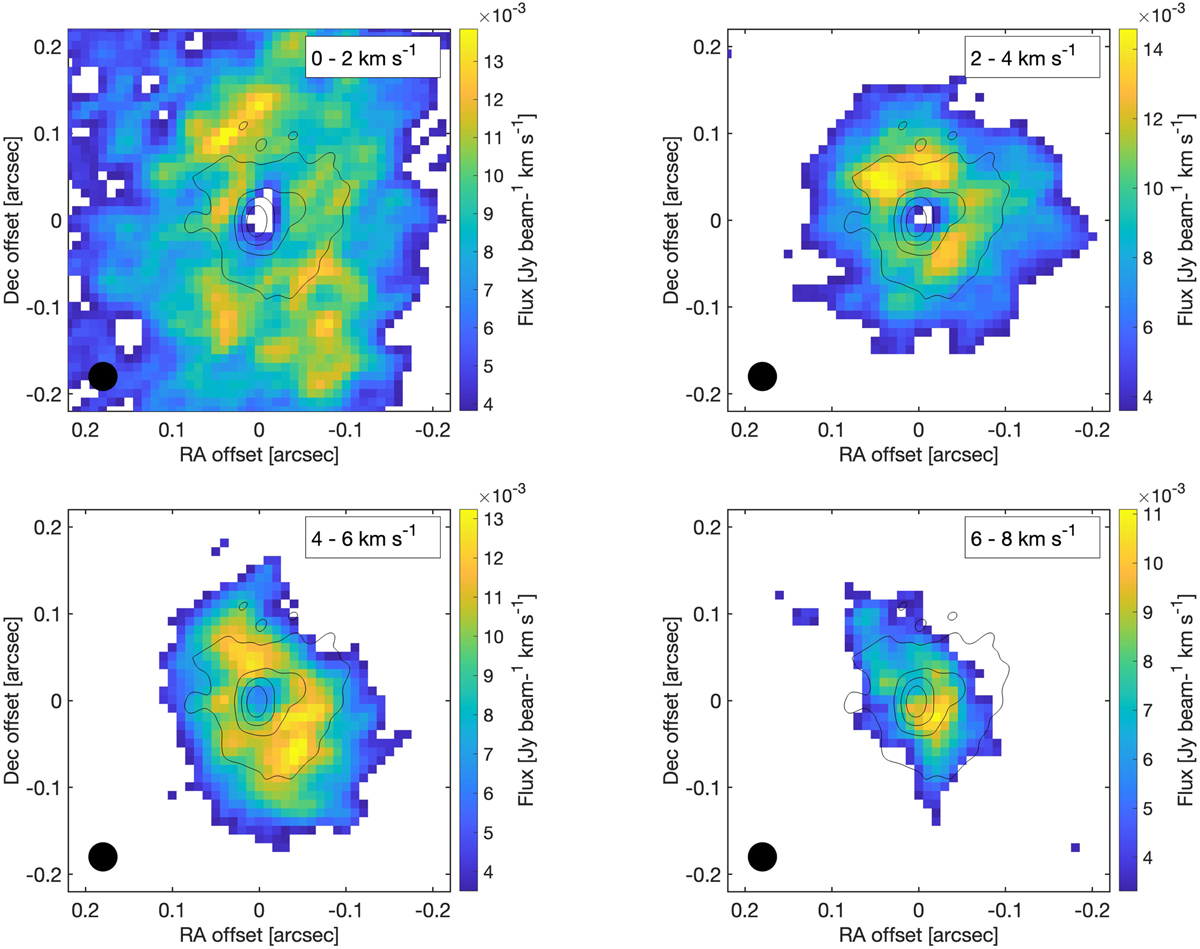
Channel maps of the observed 13CO emission in four different velocity bins. Only regions with emission above 3σ are included, and hence it should be noted that the range of the color bars slightly varies between panels, with the lower end indicating the 3σ level. Furthermore, velocities have been corrected w.r.t υLSR and the sign changed to allow for comparisons with Fig. 3.
Current usage metrics show cumulative count of Article Views (full-text article views including HTML views, PDF and ePub downloads, according to the available data) and Abstracts Views on Vision4Press platform.
Data correspond to usage on the plateform after 2015. The current usage metrics is available 48-96 hours after online publication and is updated daily on week days.
Initial download of the metrics may take a while.