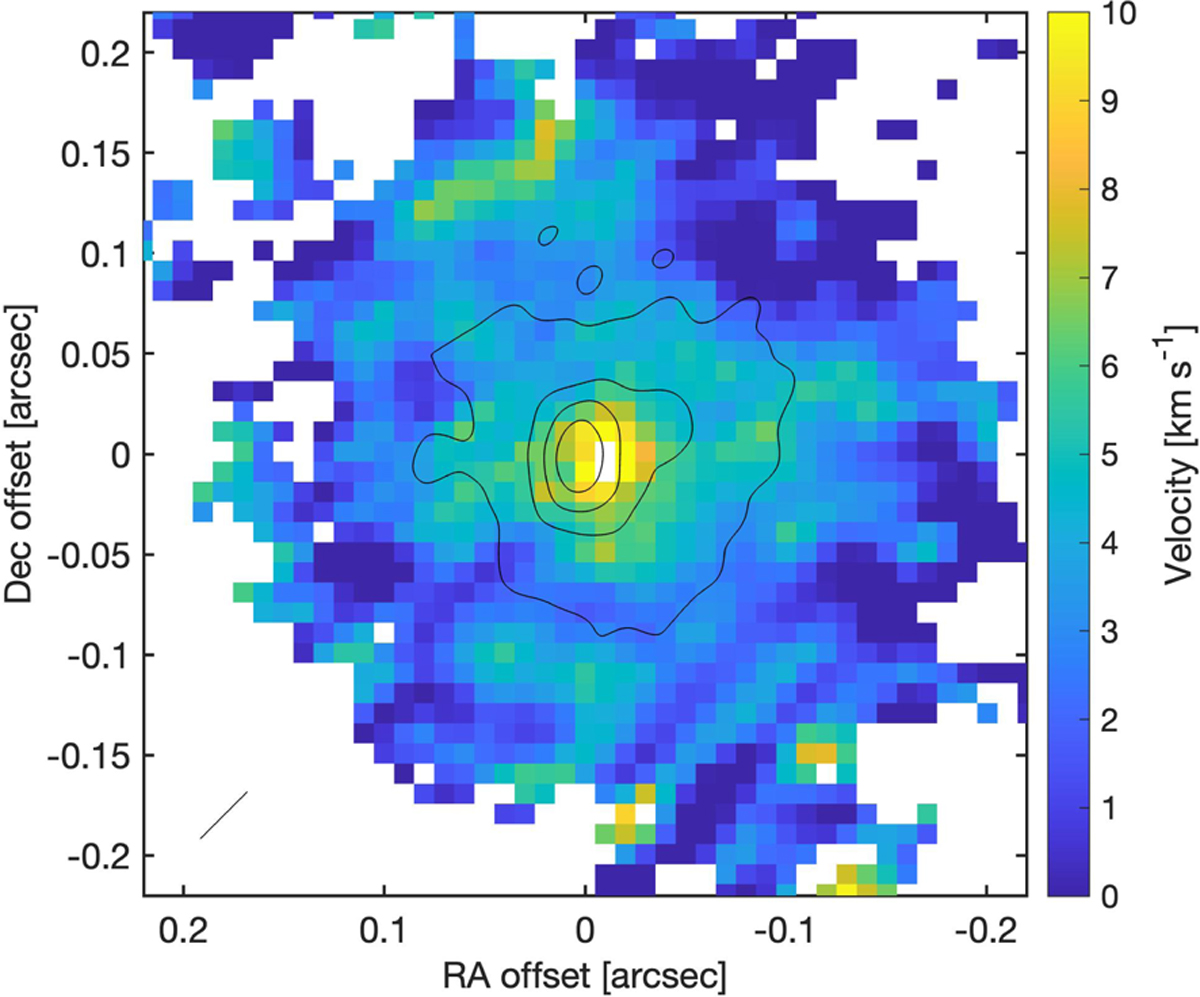
Fig. A.1
Download original image
Observed 13CO intensity weighted velocity map (moment 1). Note: the velocities have been corrected w.r.t υLSR and the sign changed to allow comparison with Fig. 3. The first moment is calculated in a velocity range from −15 to +15 km s−1 with respect to υLSR, and pixels where emission is below 3σ (σ = 0.012 Jy beam−1 km s−1) are masked out.
Current usage metrics show cumulative count of Article Views (full-text article views including HTML views, PDF and ePub downloads, according to the available data) and Abstracts Views on Vision4Press platform.
Data correspond to usage on the plateform after 2015. The current usage metrics is available 48-96 hours after online publication and is updated daily on week days.
Initial download of the metrics may take a while.