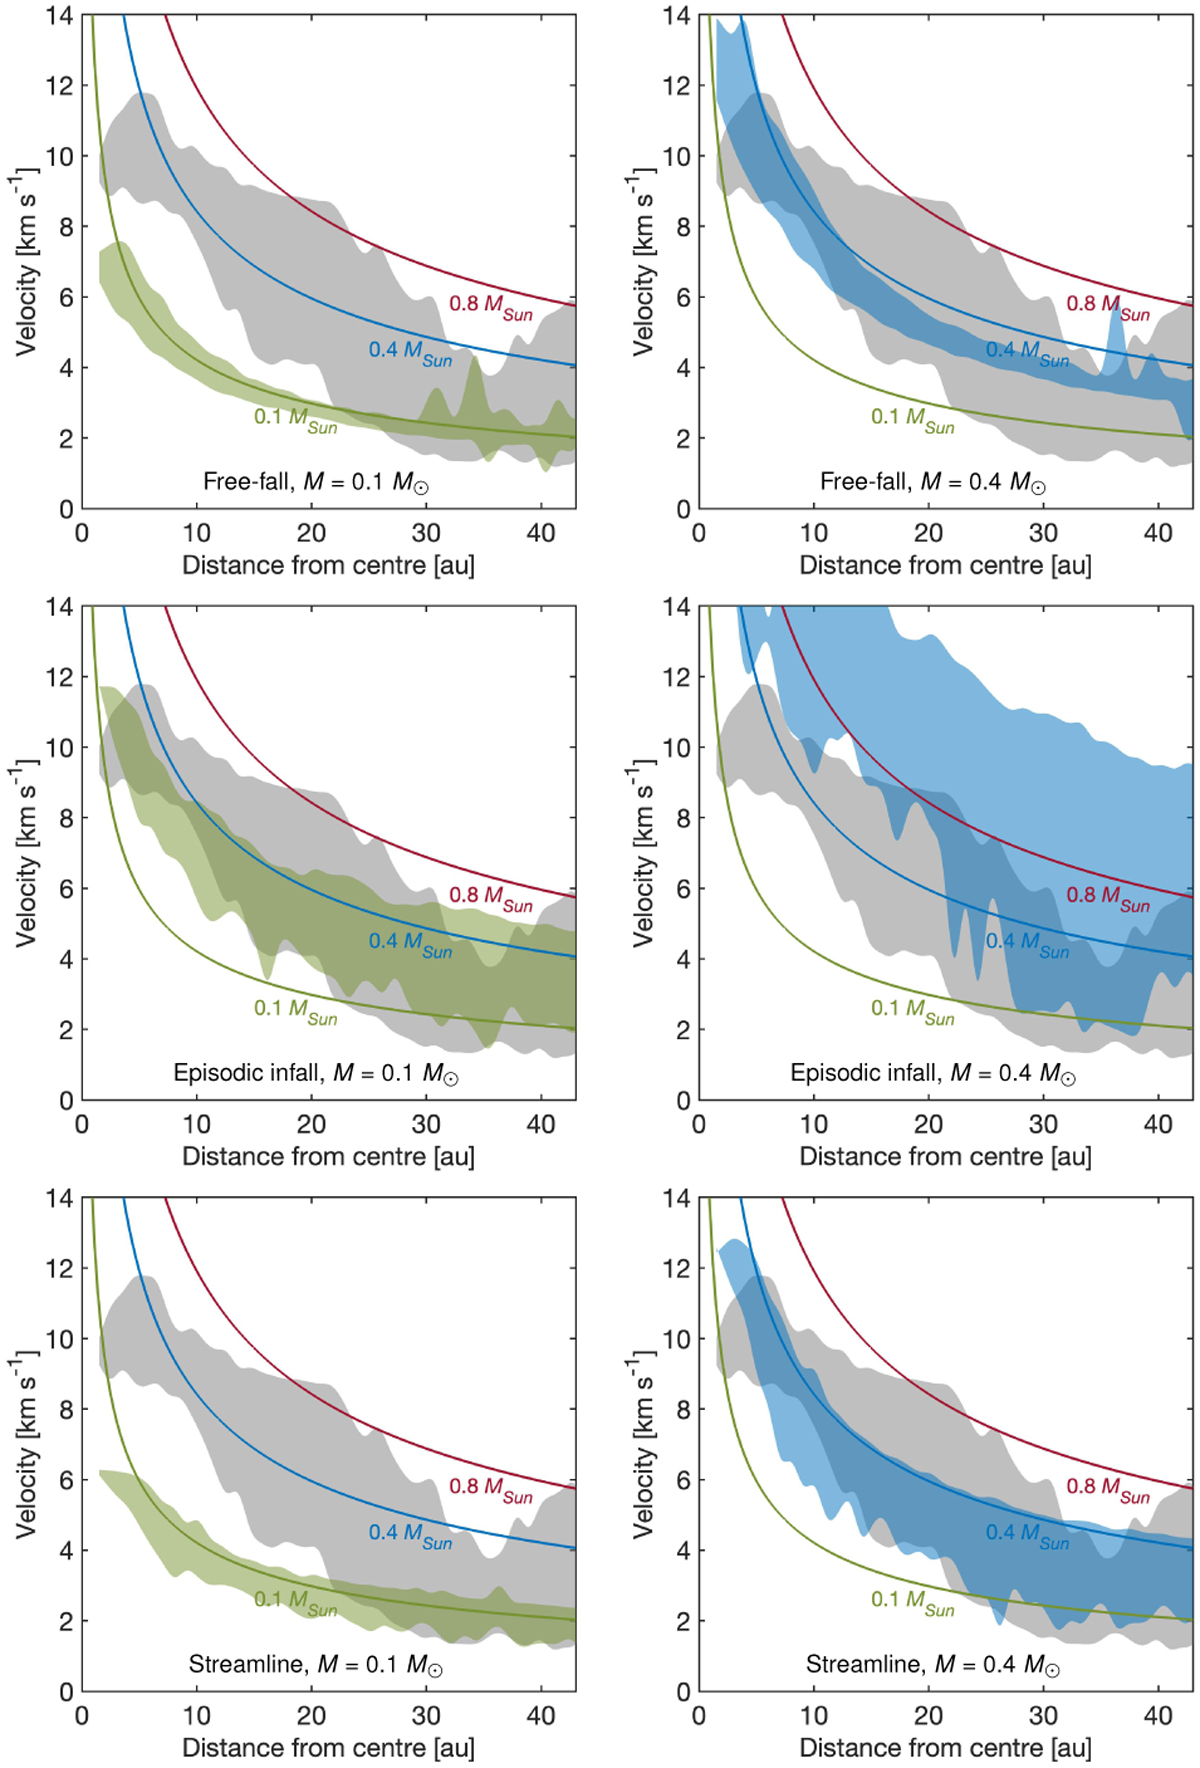
Fig. 6
Download original image
Lower limit on the infall velocity as a function of distance. Gray regions show the measured velocities from observations (same as dots in Fig. 3) while green (0.1 M⊙) and blue (0.4 M⊙) regions show the measured velocities from the models. The theoretical spherically-symmetric free-fall curves (Fig. 3) are included for comparison. Note: the spread on measured velocities increases with distance due to lower signal-to-noise ratio. In addition, a Gaussian fitting is not possible for the few spectra very close to the protostar (hence no velocity estimates in that region). Furthermore, the number of points used to create the colored colored regions vary with distance from the centre (cf., Fig. 3). For example, the ‘bumps’ at large distances in the models are caused by a relatively small number of line-width measurements.
Current usage metrics show cumulative count of Article Views (full-text article views including HTML views, PDF and ePub downloads, according to the available data) and Abstracts Views on Vision4Press platform.
Data correspond to usage on the plateform after 2015. The current usage metrics is available 48-96 hours after online publication and is updated daily on week days.
Initial download of the metrics may take a while.