Fig. 3

Download original image
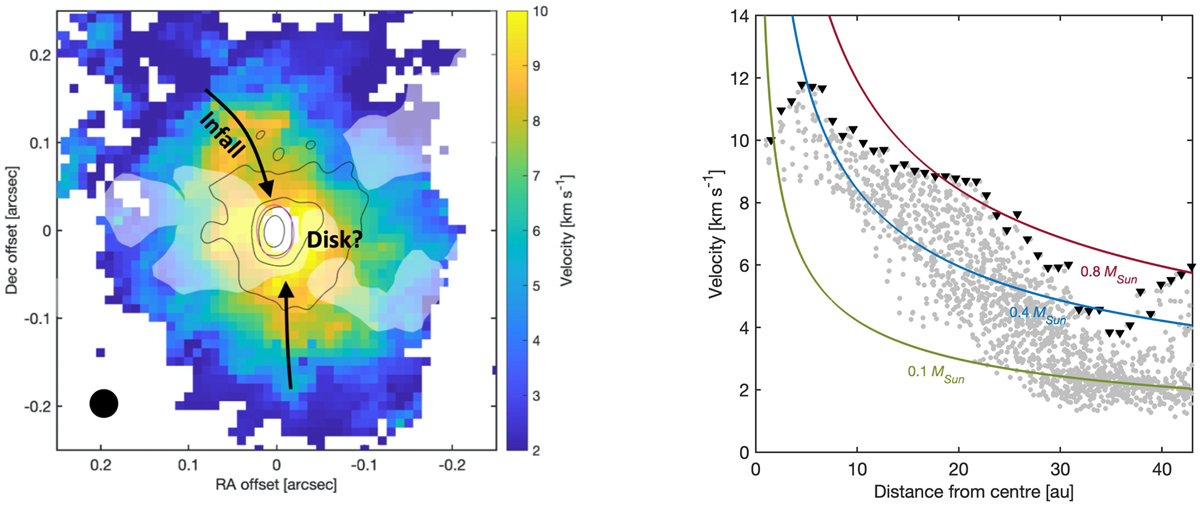
Infall velocity field. Left: lower limit on the infall velocity (colour) as estimated from the FWHM of Gaussian fits to the blue-shifted components of line profiles at each position. Translucent white regions denote where 12CO emission is detected (Bjerkeli et al. 2019) and, therefore, where contamination from the outflow could be contributing. Black contours show continuum starting at 5σ in steps of 30σ, and the red ellipse show a 2D Gaussian fit to the upper 40% of the continuum emission. For the velocity map, only positions where the coefficient of determination is higher than 0.25 are included. Right: lower limit on the infall velocity as a function of distance from the continuum peak (grey dots). Maximum measured velocities at each radii are shown with black triangles. Note: this plot takes into account every pixel in the map, and therefore some of the gray dots correspond to regions coincident with the outflow. The observed lower limit on the infall velocities are compared with the spherically-symmetric free-fall scenario for three different protostellar masses (green, blue, and red solid lines).
Current usage metrics show cumulative count of Article Views (full-text article views including HTML views, PDF and ePub downloads, according to the available data) and Abstracts Views on Vision4Press platform.
Data correspond to usage on the plateform after 2015. The current usage metrics is available 48-96 hours after online publication and is updated daily on week days.
Initial download of the metrics may take a while.


