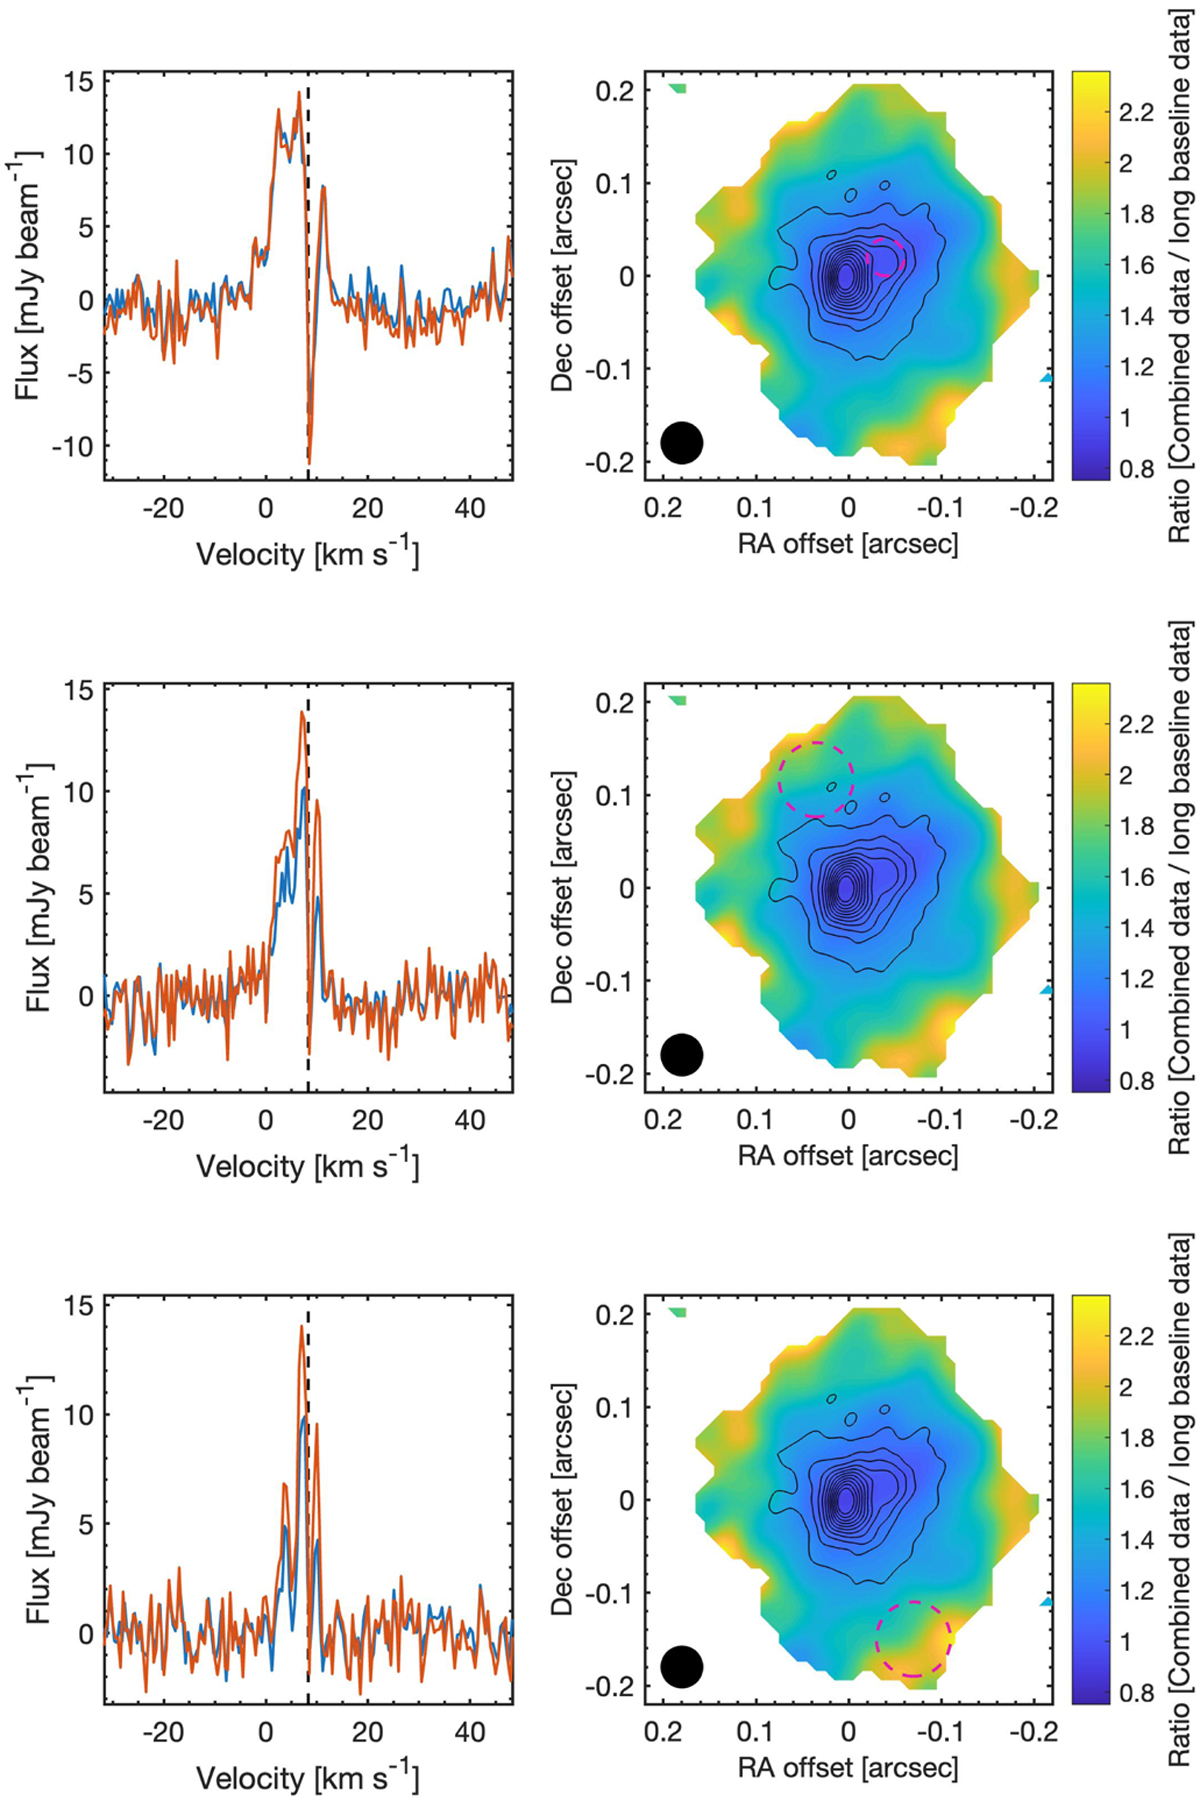
Fig. 2
Download original image
Comparisons of long-baseline and combined data line profiles Left: long-baseline (blue) and combined data (red) line profiles for three different positions (averaged over dashed purple circles in right panels). υLSR = 8.3 km s−1, is indicated with black dashed lines in the left panels. Right: the ratio of the13 CO line flux between combined and long baseline data as a function of position, where both combined and long baseline emission exceeds 3σ. The line ratio maps suggest that information on larger scales is filtered out by the interferometer. Note: the regions used for averaging in the lower two panels are slightly bigger to improve the S/N. Black contours show the continuum starting at 5σ in steps of 10σ.
Current usage metrics show cumulative count of Article Views (full-text article views including HTML views, PDF and ePub downloads, according to the available data) and Abstracts Views on Vision4Press platform.
Data correspond to usage on the plateform after 2015. The current usage metrics is available 48-96 hours after online publication and is updated daily on week days.
Initial download of the metrics may take a while.