Fig. A.4
Download original image
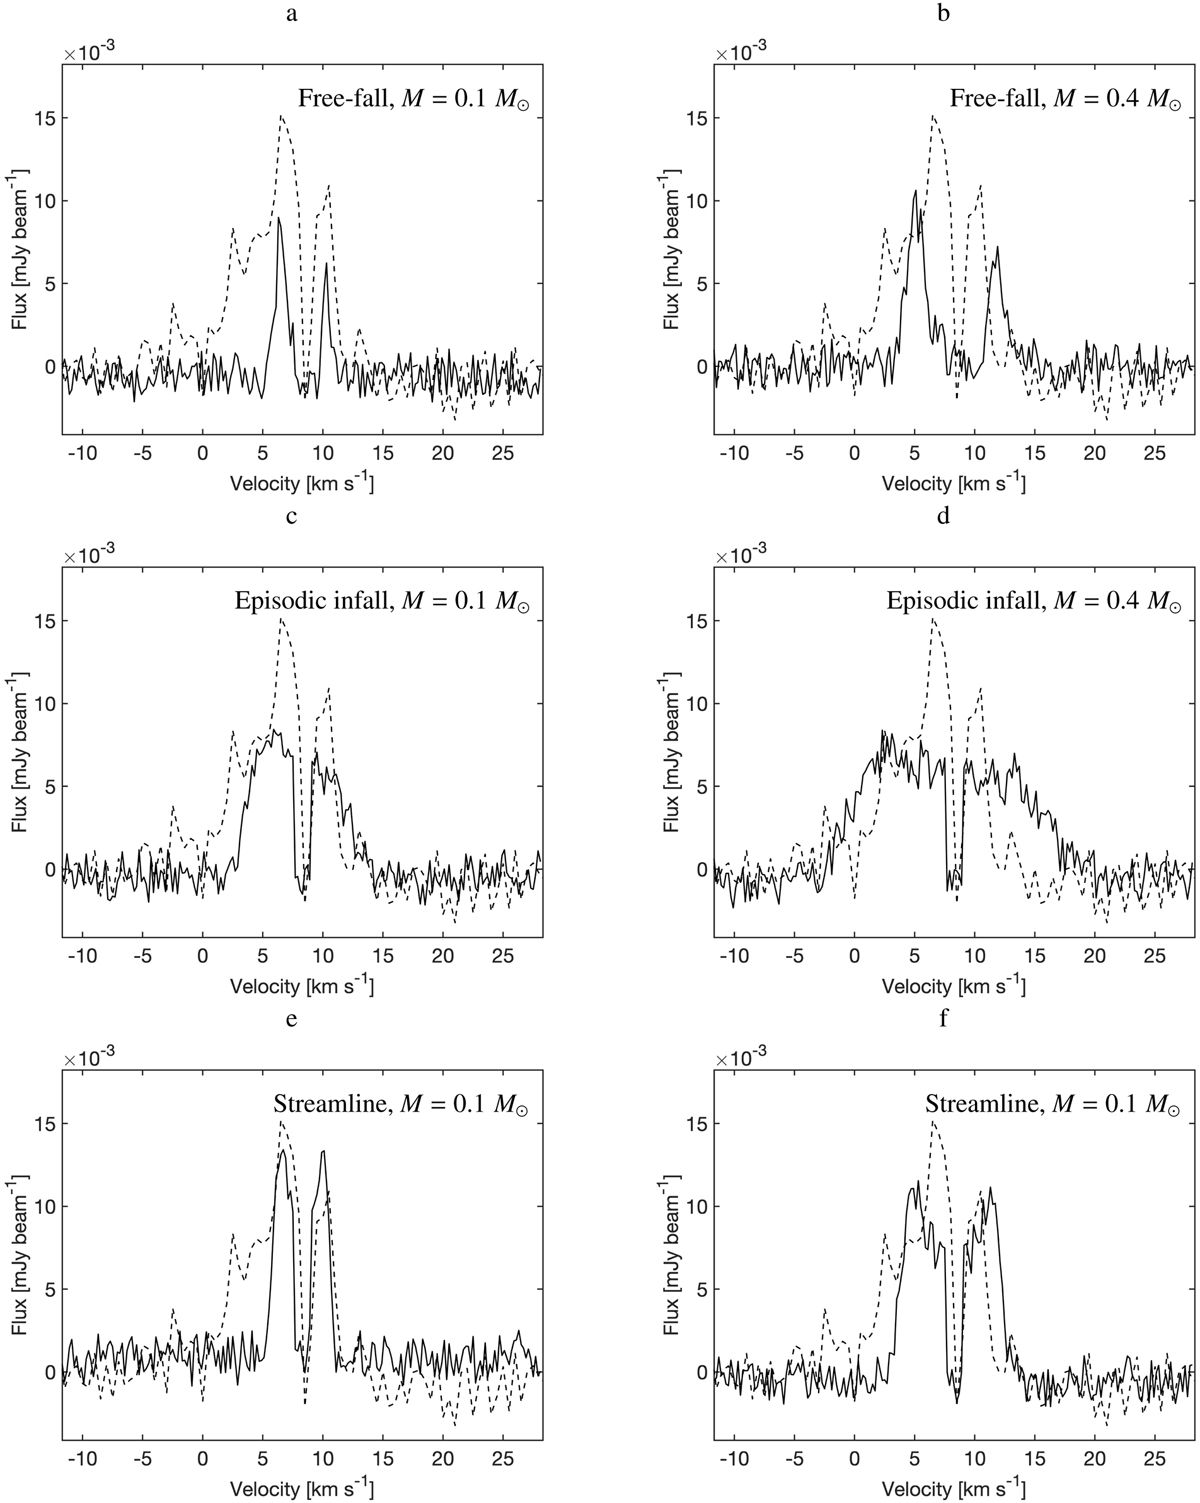
Comparison between modelled (solid line) and observed (dashed; same in all panels) line profiles towards a position 20 au north of the protostar. a) Model free-fall line profile towards a 0.1 M⊙ protostar; b) Free-fall line profile towards a 0.4 M⊙ protostar; c) Episodic infall towards a 0.1 M⊙ protostar; d) Episodic infall towards a 0.4 M⊙ protostar; e) Streamline infall along cavity walls towards a 0.1 M⊙ protostar; and f) Streamline infall along cavity walls towards a 0.4 M⊙ protostar.
Current usage metrics show cumulative count of Article Views (full-text article views including HTML views, PDF and ePub downloads, according to the available data) and Abstracts Views on Vision4Press platform.
Data correspond to usage on the plateform after 2015. The current usage metrics is available 48-96 hours after online publication and is updated daily on week days.
Initial download of the metrics may take a while.