Fig. 1
Download original image
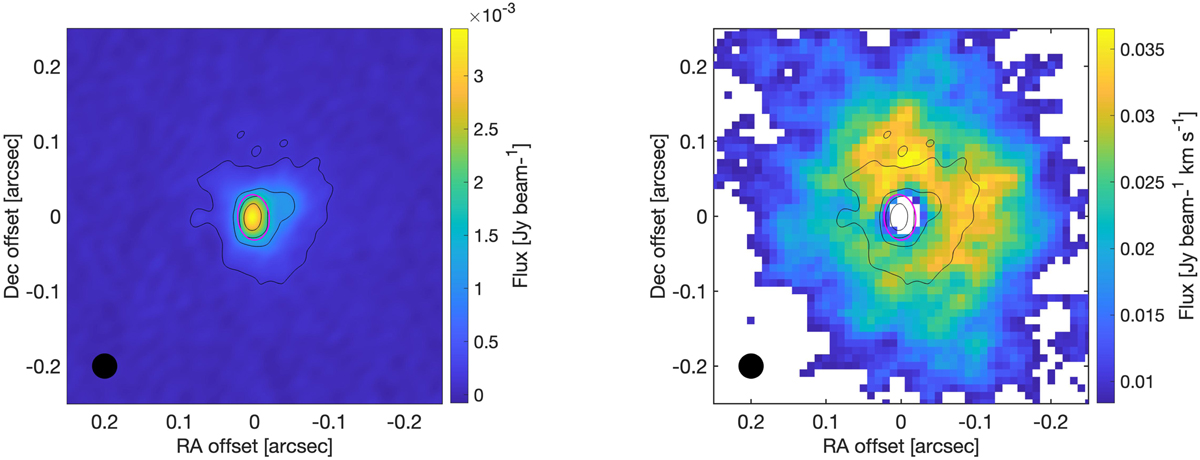
Continuum and 13CO emission around B335. Left: re-imaged continuum with line contours from 5x in steps of 30x. Purple ellipse shows a 2D Gaussian fit to the upper 40% of the continuum emission. All data were convolved to a common resolution of 0.035″ with the beam size shown on lower-left side of each panel. Right: moment 0 map of the 13CO emission, integrated from −5 to +5 km s−1 with respect to the systemic velocity of 8.3 km s−1, and overlaid with the continuum in black contours. Only regions with 13CO emission above 3σ are included.
Current usage metrics show cumulative count of Article Views (full-text article views including HTML views, PDF and ePub downloads, according to the available data) and Abstracts Views on Vision4Press platform.
Data correspond to usage on the plateform after 2015. The current usage metrics is available 48-96 hours after online publication and is updated daily on week days.
Initial download of the metrics may take a while.